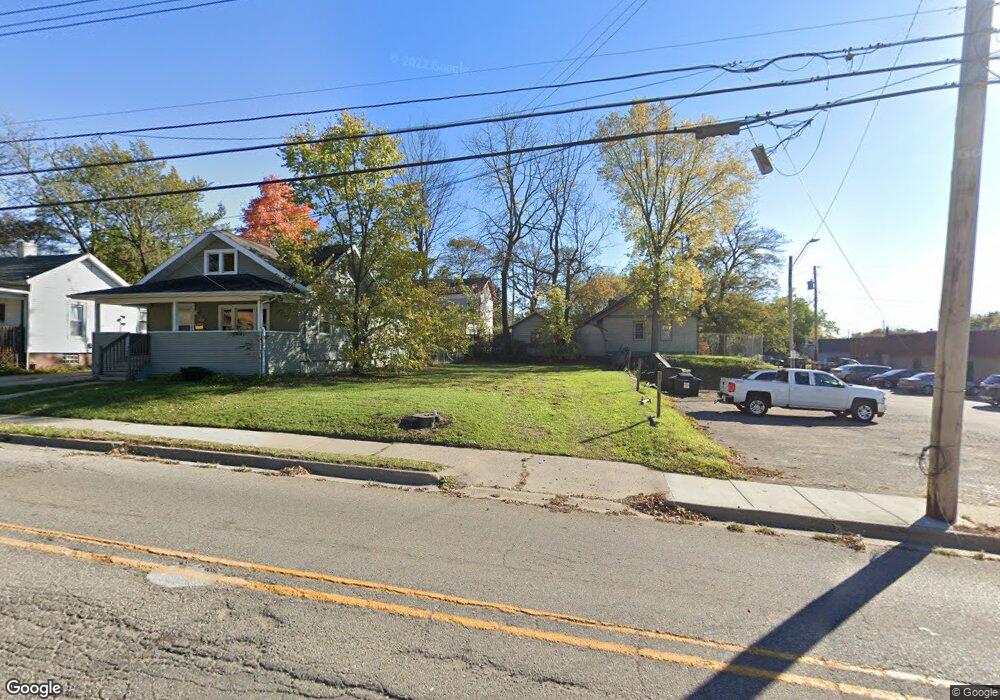
512 Baker St Lansing, MI 48910
Fabulous Acres NeighborhoodEstimated Value: $21,774 - $128,000
3
Beds
1
Bath
920
Sq Ft
$74/Sq Ft
Est. Value
About This Home
This home is located at 512 Baker St, Lansing, MI 48910 and is currently estimated at $67,925, approximately $73 per square foot. 512 Baker St is a home located in Ingham County with nearby schools including Lyons Elementary School, Pattengill Academy, and Eastern High School.
Ownership History
Date
Name
Owned For
Owner Type
Purchase Details
Closed on
Oct 14, 2009
Sold by
Building Blocks Non Profit Housing Corpo
Bought by
Ingham County Land Bank Fast Track Autho
Current Estimated Value
Purchase Details
Closed on
Jun 4, 2009
Sold by
Austin Larry and Austin Karen
Bought by
Us Bank National Association
Purchase Details
Closed on
Jan 10, 2007
Sold by
Austin Larry R
Bought by
Austin Larry R and Austin Karen F
Purchase Details
Closed on
Mar 24, 2003
Sold by
Abronowitz Kyle M and Abronowitz Mary
Bought by
Austin Larry
Home Financials for this Owner
Home Financials are based on the most recent Mortgage that was taken out on this home.
Original Mortgage
$25,600
Interest Rate
7.37%
Mortgage Type
Purchase Money Mortgage
Purchase Details
Closed on
May 27, 1999
Sold by
Rogozinski Mary M and Rogozinski Dennis L
Bought by
Rogozinski Mary M and Mary M Rogozinski Revocable Living Trust
Purchase Details
Closed on
Sep 13, 1995
Sold by
Rogozinski Mary M-Trust
Bought by
Abronowitz Kyle M
Create a Home Valuation Report for This Property
The Home Valuation Report is an in-depth analysis detailing your home's value as well as a comparison with similar homes in the area
Home Values in the Area
Average Home Value in this Area
Purchase History
| Date | Buyer | Sale Price | Title Company |
|---|---|---|---|
| Ingham County Land Bank Fast Track Autho | $9,239 | Capital Fund Title Svcs Llc | |
| Us Bank National Association | $30,600 | None Available | |
| Austin Larry R | -- | None Available | |
| Austin Larry | $32,000 | Transnation | |
| Abronowitz Kyle M | $21,400 | Transnation | |
| Rogozinski Mary M | -- | -- | |
| Abronowitz Kyle M | $21,400 | -- |
Source: Public Records
Mortgage History
| Date | Status | Borrower | Loan Amount |
|---|---|---|---|
| Previous Owner | Austin Larry | $25,600 |
Source: Public Records
Tax History
| Year | Tax Paid | Tax Assessment Tax Assessment Total Assessment is a certain percentage of the fair market value that is determined by local assessors to be the total taxable value of land and additions on the property. | Land | Improvement |
|---|---|---|---|---|
| 2025 | -- | $0 | $0 | $0 |
| 2024 | -- | $0 | $0 | $0 |
| 2023 | -- | $0 | $0 | $0 |
| 2022 | $0 | $0 | $0 | $0 |
| 2021 | $0 | $0 | $0 | $0 |
| 2020 | $0 | $0 | $0 | $0 |
| 2019 | $0 | $0 | $0 | $0 |
| 2018 | $0 | $0 | $0 | $0 |
| 2017 | $0 | $0 | $0 | $0 |
| 2016 | -- | $0 | $0 | $0 |
| 2015 | -- | $4,168 | $4,168 | $0 |
| 2014 | -- | $3,168 | $3,168 | $0 |
Source: Public Records
Map
Nearby Homes
- 506 Christiancy St
- 1515 Linval St
- 1535 Linval St
- 534 Isbell St
- 1601 Bailey St
- 616 Isbell St
- 1731 Herbert St
- 1437 Ada St
- 147 Isbell St
- 1731 Lyons Ave
- 315 E Mount Hope Ave
- 1423 Pontiac St
- 1807 Teel Ave
- 704 Mckim Ave
- 1408 Reo Ave
- 1406 Reo Ave
- 218 E Elm St
- 139 Woodlawn Ave
- 1917 Teel Ave
- 205 Moores River Dr
Your Personal Tour Guide
Ask me questions while you tour the home.