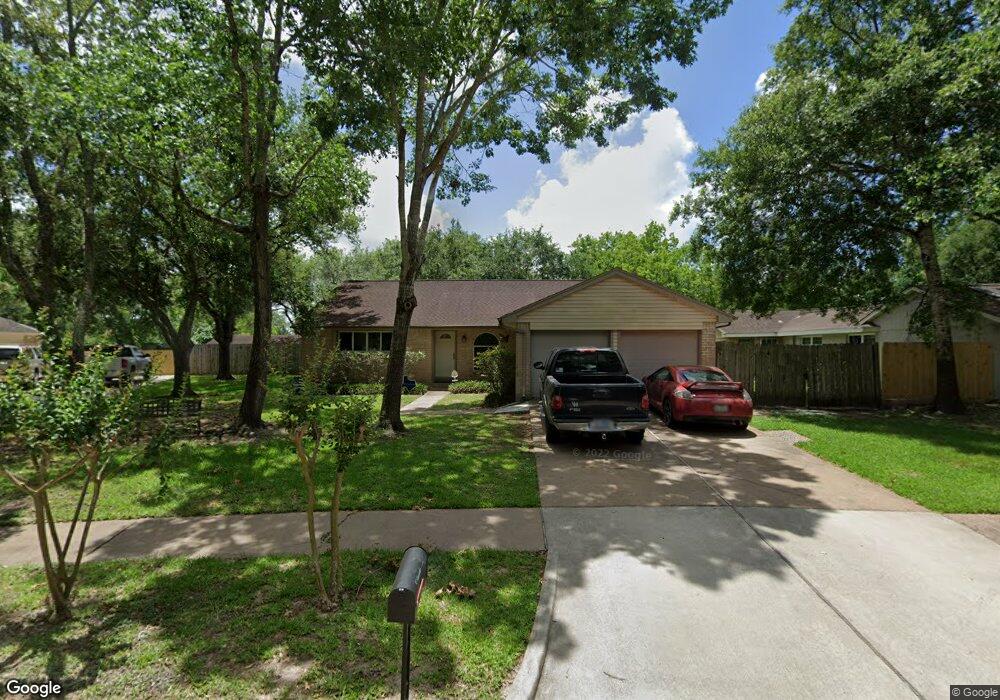
512 Belmont Dr Friendswood, TX 77546
Estimated Value: $281,000 - $312,000
--
Bed
2
Baths
1,872
Sq Ft
$154/Sq Ft
Est. Value
About This Home
This home is located at 512 Belmont Dr, Friendswood, TX 77546 and is currently estimated at $289,194, approximately $154 per square foot. 512 Belmont Dr is a home located in Galveston County with nearby schools including C.W. Cline Elementary School, Windsong Elementary School, and Friendswood Junior High School.
Ownership History
Date
Name
Owned For
Owner Type
Purchase Details
Closed on
Sep 1, 2020
Sold by
Proctor Annie L and Wallace Frankie L
Bought by
Harkor Homes Llc
Current Estimated Value
Home Financials for this Owner
Home Financials are based on the most recent Mortgage that was taken out on this home.
Original Mortgage
$79,000
Outstanding Balance
$42,355
Interest Rate
2.9%
Mortgage Type
New Conventional
Estimated Equity
$246,839
Purchase Details
Closed on
Aug 14, 2001
Sold by
Mclaren Sheri Renee
Bought by
Mclaren Lynn Randall
Purchase Details
Closed on
Jul 14, 1997
Sold by
Jewell Craig H and Jewell Kimberly K
Bought by
Mclaren Lynn R and Mclaren Sheri R
Home Financials for this Owner
Home Financials are based on the most recent Mortgage that was taken out on this home.
Original Mortgage
$82,650
Interest Rate
7.85%
Mortgage Type
Purchase Money Mortgage
Create a Home Valuation Report for This Property
The Home Valuation Report is an in-depth analysis detailing your home's value as well as a comparison with similar homes in the area
Home Values in the Area
Average Home Value in this Area
Purchase History
| Date | Buyer | Sale Price | Title Company |
|---|---|---|---|
| Harkor Homes Llc | -- | None Available | |
| Mclaren Lynn Randall | -- | -- | |
| Mclaren Lynn R | -- | Alamo Title |
Source: Public Records
Mortgage History
| Date | Status | Borrower | Loan Amount |
|---|---|---|---|
| Open | Harkor Homes Llc | $79,000 | |
| Previous Owner | Mclaren Lynn R | $82,650 | |
| Closed | Mclaren Lynn Randall | $0 |
Source: Public Records
Tax History Compared to Growth
Tax History
| Year | Tax Paid | Tax Assessment Tax Assessment Total Assessment is a certain percentage of the fair market value that is determined by local assessors to be the total taxable value of land and additions on the property. | Land | Improvement |
|---|---|---|---|---|
| 2025 | $3,728 | $250,000 | $47,063 | $202,937 |
| 2024 | $3,728 | $262,120 | $52,590 | $209,530 |
| 2023 | $3,728 | $250,625 | $0 | $0 |
| 2022 | $5,018 | $227,841 | $0 | $0 |
| 2021 | $4,838 | $230,324 | $52,590 | $177,734 |
| 2020 | $4,536 | $217,170 | $52,590 | $164,580 |
| 2019 | $4,347 | $171,180 | $28,870 | $142,310 |
| 2018 | $4,014 | $165,000 | $28,870 | $136,130 |
| 2017 | $3,710 | $165,000 | $28,870 | $136,130 |
| 2016 | $3,373 | $155,100 | $28,870 | $126,230 |
| 2015 | $1,073 | $142,140 | $28,870 | $113,270 |
| 2014 | $1,010 | $107,330 | $28,870 | $78,460 |
Source: Public Records
Map
Nearby Homes
- 644 E Castle Harbour Dr
- 601 E Castle Harbour Dr
- 40 Windsong Ln
- 2082 Wilderness Trail
- 251 Saint Cloud Dr
- 902 Longleaf Ct
- 2512 Ravenna Ct
- 110 Dorado Dr
- Amalfi Plan at Friendswood Trails
- Portofino Plan at Friendswood Trails
- Postiano Plan at Friendswood Trails
- Capri Plan at Friendswood Trails
- Ravello Plan at Friendswood Trails
- 1607 Orlando St
- 1016 Applewood Dr
- 1910 N Mission Cir
- 2211 S Mission Cir
- 1508 Harvest Vine Ct
- 2605 S Mission Cir
- 2829 Fairway Dr
- 508 Belmont Dr
- 516 Belmont Dr
- 517 Point Clear Dr
- 513 Point Clear Dr
- 504 Belmont Dr
- 521 Point Clear Dr
- 520 Belmont Dr
- 509 Point Clear Dr
- 505 Belmont Dr
- 505 Point Clear Dr
- 524 Belmont Dr
- 500 Belmont Dr
- 501 Belmont Dr
- 440 Broadmoor St
- 504 Desert Aire Dr
- 439 Broadmoor St
- 528 Belmont Dr
- 500 Desert Aire Dr
- 510 Point Clear Dr
- 436 Broadmoor St