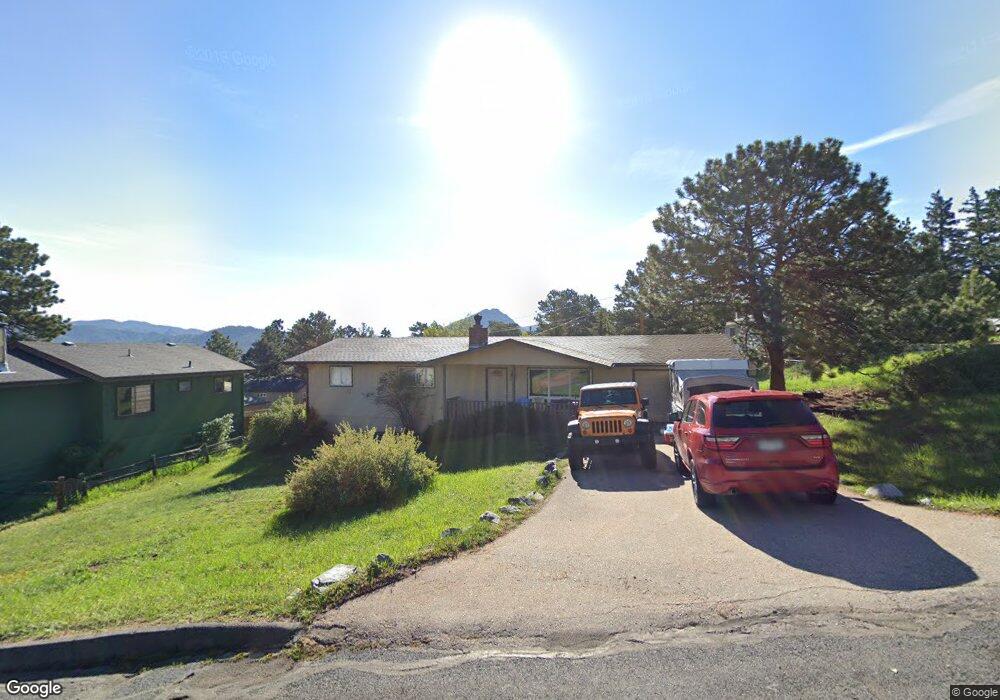
512 Birch Ave Estes Park, CO 80517
Estimated Value: $483,784 - $569,000
3
Beds
2
Baths
1,248
Sq Ft
$421/Sq Ft
Est. Value
About This Home
This home is located at 512 Birch Ave, Estes Park, CO 80517 and is currently estimated at $525,446, approximately $421 per square foot. 512 Birch Ave is a home located in Larimer County with nearby schools including Estes Park K-5 School, Estes Park Options School, and Estes Park Middle School.
Ownership History
Date
Name
Owned For
Owner Type
Purchase Details
Closed on
Jun 23, 2015
Sold by
Nydegger Jeanne R and Nydegger Kenneth M
Bought by
Nydegger Kenneth M
Current Estimated Value
Purchase Details
Closed on
Mar 6, 2012
Sold by
Nydegger Jeanne R
Bought by
Nydegger Jeanne R and Nydegger Kenneth M
Purchase Details
Closed on
Jan 28, 2011
Sold by
Nydegger John E
Bought by
Nydegger Jeanne R
Purchase Details
Closed on
Dec 7, 2010
Sold by
Rocky Mountain View Llc
Bought by
Nydegger John E and Nydegger Jeanne R
Purchase Details
Closed on
Jan 30, 2009
Sold by
Nydegger John E and Nydegger Jeanne R
Bought by
Rocky Mountain View Llc
Purchase Details
Closed on
Mar 2, 2007
Sold by
Rocky Mountain View Llc
Bought by
Nydegger John E and Nydegger Jeanne R
Purchase Details
Closed on
Oct 11, 2006
Sold by
Nydegger John E and Nydegger Jeanne R
Bought by
Rocky Mountain View Llc
Purchase Details
Closed on
Nov 1, 1987
Bought by
Nydegger John E
Create a Home Valuation Report for This Property
The Home Valuation Report is an in-depth analysis detailing your home's value as well as a comparison with similar homes in the area
Home Values in the Area
Average Home Value in this Area
Purchase History
| Date | Buyer | Sale Price | Title Company |
|---|---|---|---|
| Nydegger Kenneth M | -- | None Available | |
| Nydegger Jeanne R | -- | None Available | |
| Nydegger Jeanne R | -- | None Available | |
| Nydegger John E | -- | None Available | |
| Rocky Mountain View Llc | -- | None Available | |
| Nydegger John E | -- | None Available | |
| Rocky Mountain View Llc | -- | None Available | |
| Nydegger John E | $62,000 | -- |
Source: Public Records
Tax History Compared to Growth
Tax History
| Year | Tax Paid | Tax Assessment Tax Assessment Total Assessment is a certain percentage of the fair market value that is determined by local assessors to be the total taxable value of land and additions on the property. | Land | Improvement |
|---|---|---|---|---|
| 2025 | $2,031 | $31,416 | $13,400 | $18,016 |
| 2024 | $1,996 | $31,416 | $13,400 | $18,016 |
| 2022 | $1,970 | $25,791 | $5,977 | $19,814 |
| 2021 | $2,022 | $26,534 | $6,149 | $20,385 |
| 2020 | $1,915 | $24,803 | $6,149 | $18,654 |
| 2019 | $1,904 | $24,803 | $6,149 | $18,654 |
| 2018 | $1,336 | $16,884 | $5,544 | $11,340 |
| 2017 | $1,344 | $16,884 | $5,544 | $11,340 |
| 2016 | $1,261 | $16,796 | $5,652 | $11,144 |
| 2015 | $1,274 | $16,790 | $5,650 | $11,140 |
| 2014 | -- | $14,160 | $5,090 | $9,070 |
Source: Public Records
Map
Nearby Homes
- 517 Birch Ave
- 603 Aspen Ave Unit B4
- 603 Aspen Ave Unit C1
- 435 Columbine Ave
- 500 Elm Ave
- 407 Stanley Ave
- 404 Elm Ave
- 654 Morgan St
- 830 Morgan St
- 659 Morgan St
- TBD Stanley Ave
- 435 Moccasin Circle Dr
- 261 South Ct
- 219 3rd St
- 850 Shady Ln
- Lot 744 St Vrain Dr Unit 4723401238
- Lot 744 St Vrain Dr
- 910 Shady Ln
- 704 Birdie Ln Unit 17
- 734 Birdie Ln Unit 15
- 508 Birch Ave
- 540 Birch Ave
- 540 Birch Ave Unit 4
- 540 Birch Ave Unit 3
- 513 Aspen Ave
- 511 Aspen Ave
- 502 Birch Ave
- 515 Aspen Ave
- 509 Birch Ave
- 507 Aspen Ave
- 544 Birch Ave
- 505 Birch Ave
- 500 Birch Ave
- 541 Birch Ave
- 507 Birch Ave
- 501 Aspen Ave
- 541 Aspen Ave
- 501 Birch Ave
- 503 Birch Ave Unit 26B
- 543 Birch Ave