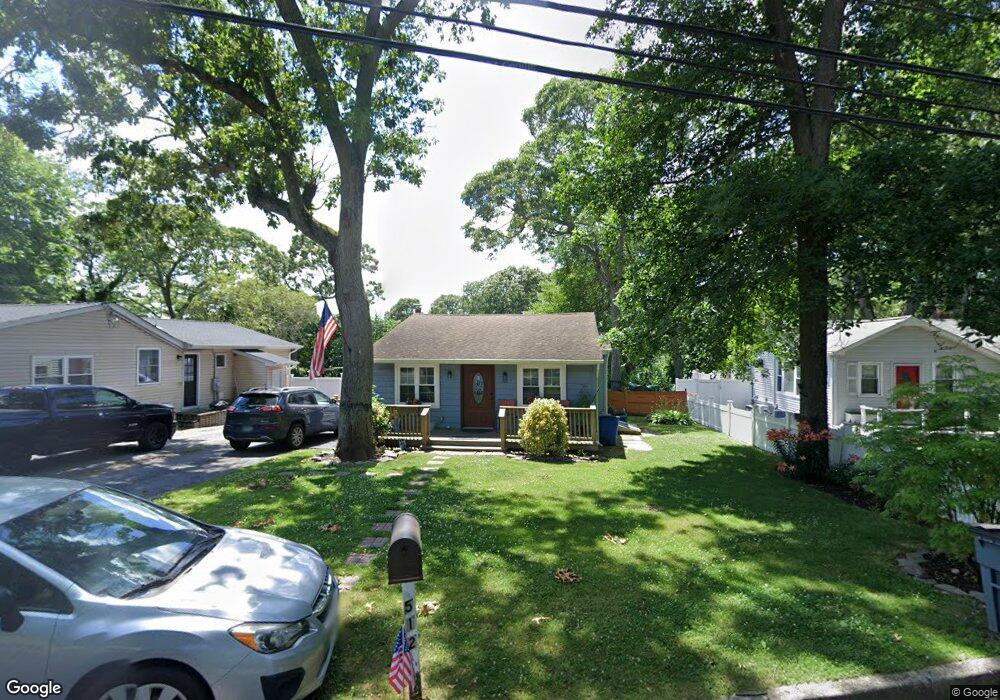
512 Browns Rd Nesconset, NY 11767
Estimated Value: $524,403 - $609,000
3
Beds
1
Bath
938
Sq Ft
$603/Sq Ft
Est. Value
About This Home
This home is located at 512 Browns Rd, Nesconset, NY 11767 and is currently estimated at $565,851, approximately $603 per square foot. 512 Browns Rd is a home located in Suffolk County with nearby schools including Wenonah Elementary School, Samoset Middle School, and Sachem High School North.
Ownership History
Date
Name
Owned For
Owner Type
Purchase Details
Closed on
Aug 17, 2016
Sold by
Good Sam Properties Inc
Bought by
Martin Jennifer and Banny Wayne
Current Estimated Value
Home Financials for this Owner
Home Financials are based on the most recent Mortgage that was taken out on this home.
Original Mortgage
$200,000
Outstanding Balance
$159,267
Interest Rate
3.42%
Mortgage Type
New Conventional
Estimated Equity
$406,584
Purchase Details
Closed on
Mar 11, 2016
Sold by
Referee Of Suffolk County and Goldsmith Mark J
Bought by
Good Sam Properties Inc
Purchase Details
Closed on
Sep 22, 1997
Sold by
Manning Kevin Lee
Bought by
Migneco Robert and Migneco Stephanie
Home Financials for this Owner
Home Financials are based on the most recent Mortgage that was taken out on this home.
Original Mortgage
$60,000
Interest Rate
7.03%
Create a Home Valuation Report for This Property
The Home Valuation Report is an in-depth analysis detailing your home's value as well as a comparison with similar homes in the area
Home Values in the Area
Average Home Value in this Area
Purchase History
| Date | Buyer | Sale Price | Title Company |
|---|---|---|---|
| Martin Jennifer | $250,000 | None Available | |
| Martin Jennifer | $250,000 | None Available | |
| Good Sam Properties Inc | $125,800 | None Available | |
| Good Sam Properties Inc | $125,800 | None Available | |
| Migneco Robert | $80,000 | Chicago Title Insurance Co | |
| Migneco Robert | $80,000 | Chicago Title Insurance Co |
Source: Public Records
Mortgage History
| Date | Status | Borrower | Loan Amount |
|---|---|---|---|
| Open | Martin Jennifer | $200,000 | |
| Closed | Martin Jennifer | $200,000 | |
| Previous Owner | Migneco Robert | $60,000 | |
| Closed | Good Sam Properties Inc | $0 |
Source: Public Records
Tax History
| Year | Tax Paid | Tax Assessment Tax Assessment Total Assessment is a certain percentage of the fair market value that is determined by local assessors to be the total taxable value of land and additions on the property. | Land | Improvement |
|---|---|---|---|---|
| 2024 | $6,858 | $2,815 | $200 | $2,615 |
| 2023 | $6,858 | $2,815 | $200 | $2,615 |
| 2022 | $5,606 | $2,815 | $200 | $2,615 |
| 2021 | $5,606 | $2,815 | $200 | $2,615 |
| 2020 | $6,850 | $2,815 | $200 | $2,615 |
| 2019 | $6,850 | $0 | $0 | $0 |
| 2018 | -- | $2,815 | $200 | $2,615 |
| 2017 | $6,370 | $2,815 | $200 | $2,615 |
| 2016 | $5,491 | $2,430 | $200 | $2,230 |
| 2015 | -- | $2,430 | $200 | $2,230 |
| 2014 | -- | $2,430 | $200 | $2,230 |
Source: Public Records
Map
Nearby Homes
Your Personal Tour Guide
Ask me questions while you tour the home.