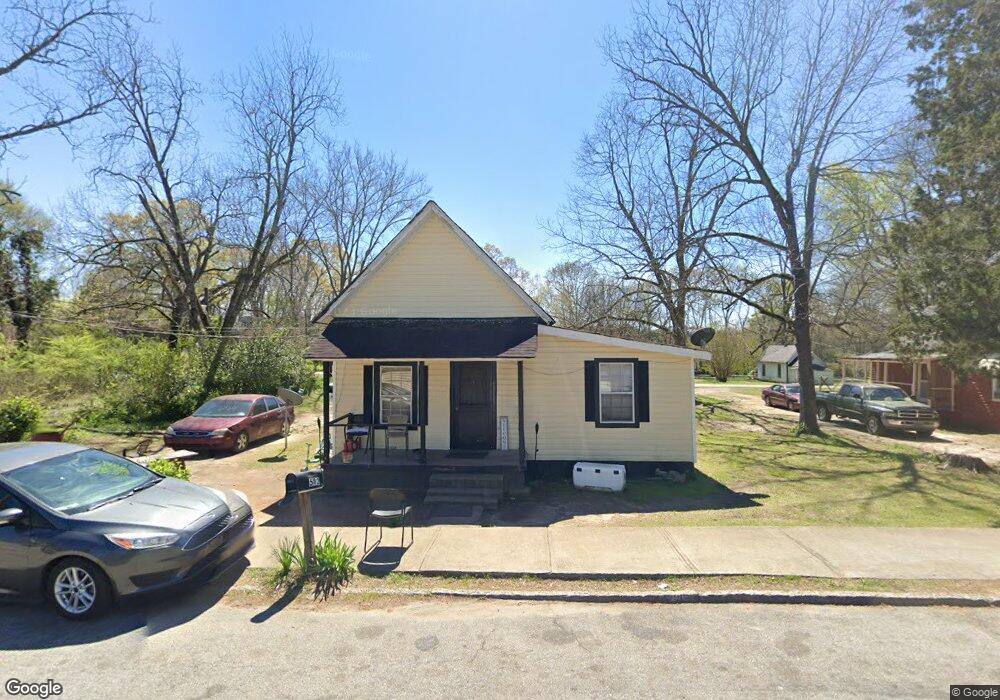
512 Cherry St Greensboro, GA 30642
Estimated Value: $52,000 - $317,000
1
Bed
1
Bath
1,072
Sq Ft
$157/Sq Ft
Est. Value
About This Home
This home is located at 512 Cherry St, Greensboro, GA 30642 and is currently estimated at $168,186, approximately $156 per square foot. 512 Cherry St is a home located in Greene County with nearby schools including Greene County High School.
Ownership History
Date
Name
Owned For
Owner Type
Purchase Details
Closed on
May 31, 2024
Sold by
Rhodes & Rhodes Properties Inc
Bought by
Twin Partners Llc
Current Estimated Value
Purchase Details
Closed on
Feb 18, 2003
Sold by
Rhodes Marion
Bought by
Rhodes & Rhodes Prop Inc
Purchase Details
Closed on
Feb 25, 2000
Sold by
Smith Laurance D
Bought by
Rhodes Marion
Purchase Details
Closed on
Jan 1, 1983
Sold by
Bryant Charles
Bought by
Smith Laurance D
Purchase Details
Closed on
Jan 1, 1981
Sold by
Gainer Mary B
Bought by
Bryant Charles
Purchase Details
Closed on
Jan 1, 1976
Sold by
Kirk James G
Bought by
Gainer Mary B
Purchase Details
Closed on
Jan 1, 1974
Sold by
Thompson Henretta P Mrs
Bought by
Kirk James G
Purchase Details
Closed on
Jan 1, 1972
Sold by
Thompson A D
Bought by
Thompson Henretta P Mrs
Purchase Details
Closed on
Jan 1, 1967
Bought by
Thompson A D
Create a Home Valuation Report for This Property
The Home Valuation Report is an in-depth analysis detailing your home's value as well as a comparison with similar homes in the area
Home Values in the Area
Average Home Value in this Area
Purchase History
| Date | Buyer | Sale Price | Title Company |
|---|---|---|---|
| Twin Partners Llc | $110,000 | -- | |
| Rhodes & Rhodes Prop Inc | -- | -- | |
| Rhodes Marion | $2,500 | -- | |
| Smith Laurance D | -- | -- | |
| Bryant Charles | -- | -- | |
| Bryant Charles | -- | -- | |
| Gainer Mary B | -- | -- | |
| Kirk James G | -- | -- | |
| Thompson Henretta P Mrs | -- | -- | |
| Thompson A D | -- | -- |
Source: Public Records
Tax History Compared to Growth
Tax History
| Year | Tax Paid | Tax Assessment Tax Assessment Total Assessment is a certain percentage of the fair market value that is determined by local assessors to be the total taxable value of land and additions on the property. | Land | Improvement |
|---|---|---|---|---|
| 2024 | $581 | $16,200 | $3,200 | $13,000 |
| 2023 | $520 | $15,040 | $3,200 | $11,840 |
| 2022 | $392 | $12,520 | $1,600 | $10,920 |
| 2021 | $405 | $11,240 | $1,600 | $9,640 |
| 2020 | $271 | $5,200 | $1,520 | $3,680 |
| 2019 | $275 | $5,200 | $1,520 | $3,680 |
| 2018 | $252 | $5,200 | $1,520 | $3,680 |
| 2017 | $245 | $5,233 | $1,530 | $3,703 |
| 2016 | $249 | $5,387 | $1,530 | $3,857 |
| 2015 | $220 | $5,387 | $1,530 | $3,857 |
| 2014 | $230 | $5,744 | $1,530 | $4,214 |
Source: Public Records
Map
Nearby Homes
- 0 Maple Cir
- 314 W South St
- 208 W South St
- 1061 Grimes St
- 301 N East St
- 15 South St Unit Siloam Road
- 1020 Horton Dr
- 805 S West St
- 504 Martin Luther King Junior Dr
- 0 Railroad St Unit 218854
- 0 Railroad St Unit 10578007
- 0 Railroad St Unit 531919
- 0 Canaan St
- 109 Reynolds Dr
- 105 Wilson St
- 1531 E Broad St
- 1060 Twin Pines Cir
- 1141 Armour Cir
- 1131 Planing Mill Rd
- 1311 Lighthouse Cir
- 514 Cherry St
- 510 Cherry St
- 516 Cherry St
- 511 Mill St
- 0 W Cherry St Unit 7493286
- 511 Cherry St
- 513 Mill St
- 507 Cherry St
- 515 Mill St
- 507 Mill St
- 518 Cherry St
- 515 Cherry St
- 0 Mill St Unit 8091374
- 0 Mill St Unit 8250563
- 1110 Mill St
- 0 Mill St Unit 8319801
- 0 Mill St Unit 24
- 1300 Mill St
- 1200 Mill St
- 1171 Mill St