512 Community St Lansing, MI 48906
Creston NeighborhoodEstimated Value: $76,000 - $138,000
3
Beds
1
Bath
1,008
Sq Ft
$118/Sq Ft
Est. Value
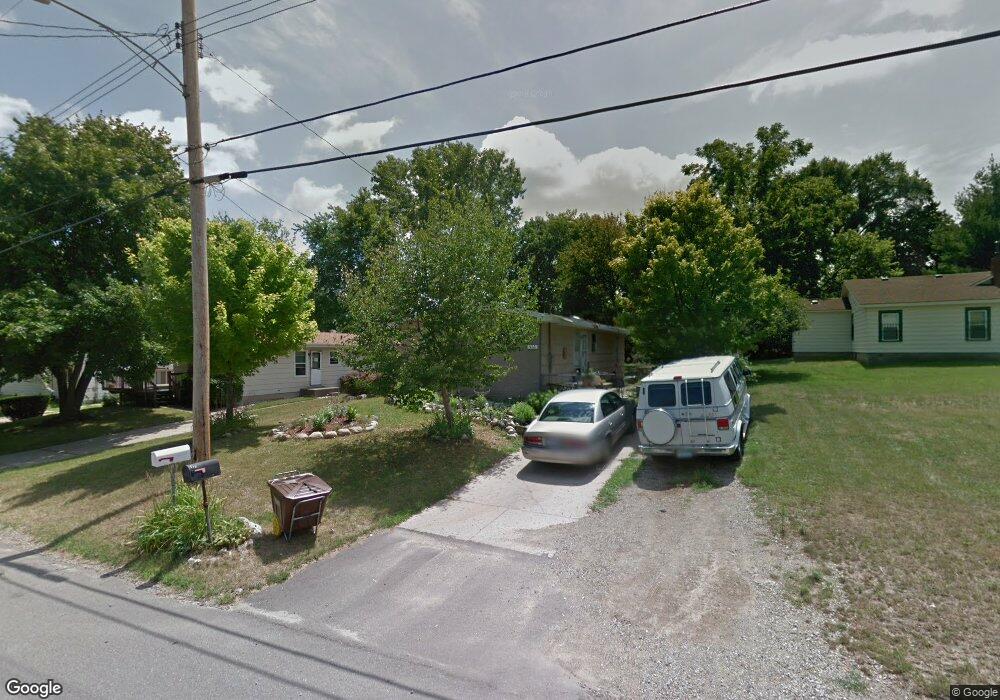
About This Home
This home is located at 512 Community St, Lansing, MI 48906 and is currently estimated at $118,650, approximately $117 per square foot. 512 Community St is a home located in Ingham County with nearby schools including Gier Park School, Pattengill Academy, and Eastern High School.
Ownership History
Date
Name
Owned For
Owner Type
Purchase Details
Closed on
May 10, 2019
Sold by
White Mara Anne Alden
Bought by
White Mara Anne Alden and Harr Brandon Kristopher
Current Estimated Value
Purchase Details
Closed on
May 1, 2017
Sold by
Wells Fargo Bank Na
Bought by
Alden White Mara Anne
Purchase Details
Closed on
Sep 8, 2016
Sold by
Lammers George A
Bought by
Wells Fargo Bank
Purchase Details
Closed on
Jul 28, 2000
Sold by
Larson Matthew C
Bought by
Millan Alejandro
Home Financials for this Owner
Home Financials are based on the most recent Mortgage that was taken out on this home.
Original Mortgage
$72,950
Interest Rate
8.19%
Mortgage Type
Purchase Money Mortgage
Purchase Details
Closed on
Aug 14, 1998
Sold by
Casler Marsha J
Bought by
Larson Matthew C
Purchase Details
Closed on
Dec 21, 1990
Sold by
Freed Wesley
Bought by
Casler Marsha J
Create a Home Valuation Report for This Property
The Home Valuation Report is an in-depth analysis detailing your home's value as well as a comparison with similar homes in the area
Home Values in the Area
Average Home Value in this Area
Purchase History
| Date | Buyer | Sale Price | Title Company |
|---|---|---|---|
| White Mara Anne Alden | -- | None Available | |
| Alden White Mara Anne | $22,000 | None Available | |
| Wells Fargo Bank | -- | None Available | |
| Millan Alejandro | $73,000 | -- | |
| Larson Matthew C | $34,900 | -- | |
| Casler Marsha J | $35,500 | -- |
Source: Public Records
Mortgage History
| Date | Status | Borrower | Loan Amount |
|---|---|---|---|
| Previous Owner | Millan Alejandro | $72,950 |
Source: Public Records
Tax History Compared to Growth
Tax History
| Year | Tax Paid | Tax Assessment Tax Assessment Total Assessment is a certain percentage of the fair market value that is determined by local assessors to be the total taxable value of land and additions on the property. | Land | Improvement |
|---|---|---|---|---|
| 2025 | $3,177 | $47,800 | $7,800 | $40,000 |
| 2024 | $26 | $45,200 | $7,800 | $37,400 |
| 2023 | $2,990 | $41,200 | $7,800 | $33,400 |
| 2022 | $4,802 | $37,000 | $7,000 | $30,000 |
| 2021 | $2,082 | $36,800 | $5,300 | $31,500 |
| 2020 | $2,069 | $34,600 | $5,300 | $29,300 |
| 2019 | $1,872 | $31,300 | $5,300 | $26,000 |
| 2018 | $1,756 | $29,100 | $5,300 | $23,800 |
| 2017 | $2,106 | $29,100 | $5,300 | $23,800 |
| 2016 | $1,537 | $28,600 | $5,300 | $23,300 |
| 2015 | $1,537 | $28,000 | $10,627 | $17,373 |
| 2014 | $1,537 | $26,800 | $13,018 | $13,782 |
Source: Public Records
Map
Nearby Homes
- 533 Community St
- 712 Sanford St
- 816 Orchard Glen Ave
- 2508 Gary Ave
- 801 Banghart St
- 310 W Frederick Ave
- 3425 Turner Rd
- 213 E Thomas St
- 152 Donald Ave Unit 152
- 109 Desander Dr Unit 109
- 151 Donald Ave Unit 151
- 117 Desander Dr Unit 117
- 85 Nettie Ave Unit 85
- 415 Filley St
- 2318 N High St
- 1919 N East St
- 627 W Frederick Ave
- 0 Lake Lansing Rd Unit 289258
- 1016 Lake Lansing Rd
- 16550 S Us 27
- 516 Community St
- 3120 N Cedar St
- 524 Community St
- 3108 N Cedar St
- 517 E Paulson St
- 3200 N Cedar St
- 521 E Paulson St
- 517 Community St
- 530 Community St
- 436 Community St
- 436 Community St Unit y St
- 527 E Paulson St
- 523 Community St
- 3210 N Cedar St
- 531 E Paulson St
- 3211 N Cedar St
- 3220 N Cedar St
- 537 Community St
- 426 Community St
- 427 E Paulson St