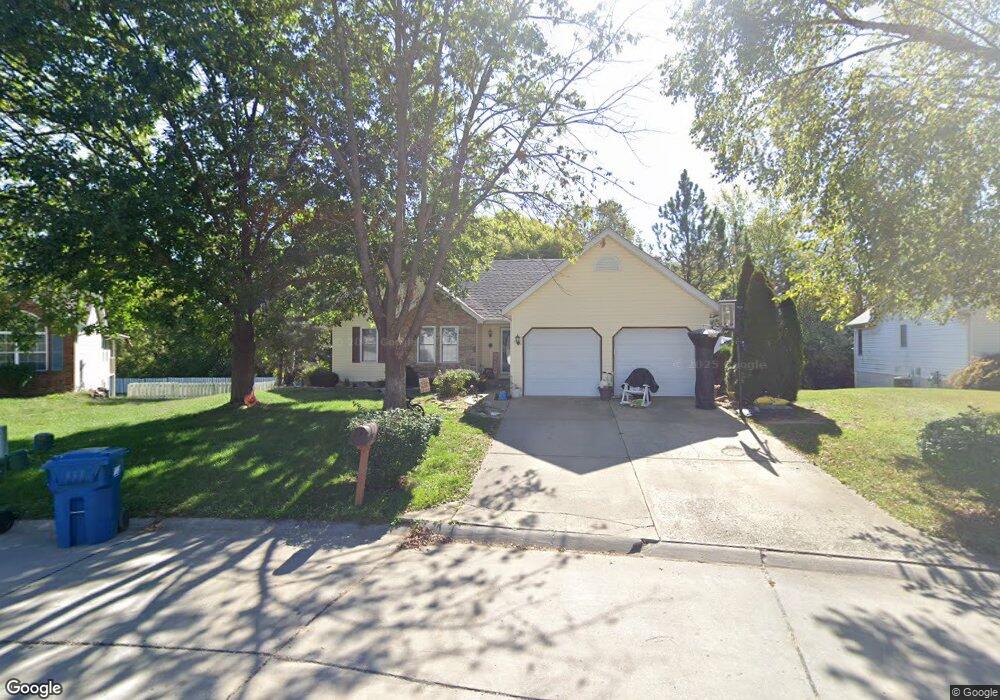
512 Copper Bend Rd Maryville, IL 62062
Estimated Value: $276,000 - $346,000
3
Beds
3
Baths
1,338
Sq Ft
$236/Sq Ft
Est. Value
About This Home
This home is located at 512 Copper Bend Rd, Maryville, IL 62062 and is currently estimated at $316,204, approximately $236 per square foot. 512 Copper Bend Rd is a home located in Madison County with nearby schools including Maryville Elementary School, Dorris Intermediate School, and Collinsville Middle School.
Ownership History
Date
Name
Owned For
Owner Type
Purchase Details
Closed on
Jan 21, 2015
Sold by
Rolston Leroy A and Rolston Nicol A
Bought by
Ferguson Douglas W and Ferguson Jennifer L
Current Estimated Value
Home Financials for this Owner
Home Financials are based on the most recent Mortgage that was taken out on this home.
Original Mortgage
$140,000
Outstanding Balance
$107,352
Interest Rate
3.87%
Mortgage Type
New Conventional
Estimated Equity
$208,852
Purchase Details
Closed on
Jul 2, 2003
Sold by
Wiese Michael J
Bought by
Rolston Leroy A and Rolston Nicol A
Home Financials for this Owner
Home Financials are based on the most recent Mortgage that was taken out on this home.
Original Mortgage
$147,318
Interest Rate
5.4%
Mortgage Type
VA
Create a Home Valuation Report for This Property
The Home Valuation Report is an in-depth analysis detailing your home's value as well as a comparison with similar homes in the area
Home Values in the Area
Average Home Value in this Area
Purchase History
| Date | Buyer | Sale Price | Title Company |
|---|---|---|---|
| Ferguson Douglas W | $175,000 | Abstracts & Titles Inc | |
| Rolston Leroy A | $144,500 | Abstracts & Titles Inc |
Source: Public Records
Mortgage History
| Date | Status | Borrower | Loan Amount |
|---|---|---|---|
| Open | Ferguson Douglas W | $140,000 | |
| Previous Owner | Rolston Leroy A | $147,318 |
Source: Public Records
Tax History Compared to Growth
Tax History
| Year | Tax Paid | Tax Assessment Tax Assessment Total Assessment is a certain percentage of the fair market value that is determined by local assessors to be the total taxable value of land and additions on the property. | Land | Improvement |
|---|---|---|---|---|
| 2024 | $5,516 | $88,310 | $19,510 | $68,800 |
| 2023 | $5,516 | $81,740 | $18,060 | $63,680 |
| 2022 | $5,204 | $75,590 | $16,700 | $58,890 |
| 2021 | $4,463 | $67,990 | $14,950 | $53,040 |
| 2020 | $4,292 | $64,870 | $14,260 | $50,610 |
| 2019 | $4,163 | $62,650 | $13,770 | $48,880 |
| 2018 | $4,054 | $59,350 | $13,040 | $46,310 |
| 2017 | $4,034 | $58,170 | $12,780 | $45,390 |
| 2016 | $4,830 | $59,630 | $12,780 | $46,850 |
| 2015 | $4,374 | $58,080 | $12,450 | $45,630 |
| 2014 | $4,374 | $62,390 | $12,450 | $49,940 |
| 2013 | $4,374 | $62,390 | $12,450 | $49,940 |
Source: Public Records
Map
Nearby Homes
- 1 Heather Green
- 1831 Crimson Oak Dr
- 1844 Crimson Oak Dr
- 419 N Donk Ave
- 2009 Buttonwood Ct
- 1819 Robin Mills Ct
- 1830 Robin Mills Ct
- 1826 Robin Mills Ct
- 1815 Robins Mill Ct
- 201 S Lange Ave
- 137 W Zupan St
- 2301 Preswyck Ct
- 226 Woodridge Ct
- 501 Drost St
- 963 Long Branch Rd
- 189 Meyer Dr
- 130 Hilltop Place
- 6817 Bouse Rd
- 7 Keiths Ct
- 10 Dunbridge Ct
- 508 Copper Bend Rd
- 520 Copper Bend Rd
- 504 Copper Bend Rd
- 505 Copper Bend Rd
- 500 Copper Bend Rd
- 524 Copper Bend Rd
- 601 Copper Line Rd
- 509 Copper Bend Rd
- 920 Woodland Dr
- 605 Copper Line Rd
- 528 Copper Bend Rd
- 924 Woodland Dr
- 424 Copper Bend Rd
- 513 Copper Bend Rd
- 916 Woodland Dr
- 609 Copper Line Rd
- 420 Copper Bend Rd
- 912 Woodland Dr
- 600 Copper Line Rd
- 613 Copper Line Rd