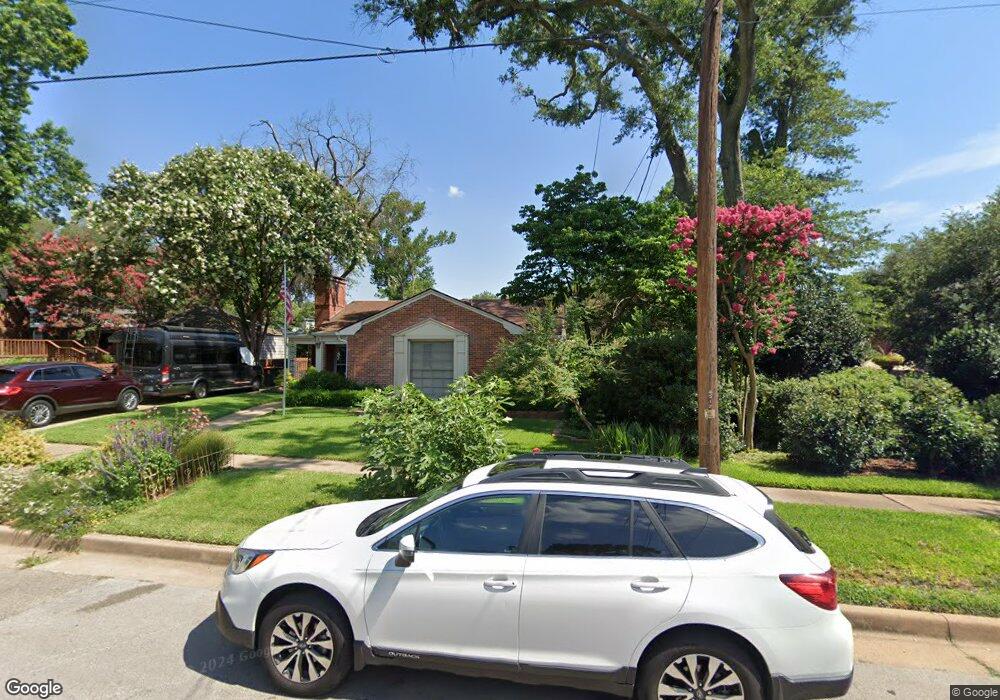
512 E 3rd St Tyler, TX 75701
Azalea District NeighborhoodEstimated Value: $413,439 - $501,000
4
Beds
3
Baths
2,878
Sq Ft
$156/Sq Ft
Est. Value
About This Home
This home is located at 512 E 3rd St, Tyler, TX 75701 and is currently estimated at $450,360, approximately $156 per square foot. 512 E 3rd St is a home located in Smith County with nearby schools including Bell Elementary School, Hubbard Middle School, and Tyler Legacy High School.
Ownership History
Date
Name
Owned For
Owner Type
Purchase Details
Closed on
Feb 26, 2018
Sold by
Clyde Thomas William and Wilson Carole Elizabeth
Bought by
Browder Elizabeth J and Demere Jon R
Current Estimated Value
Home Financials for this Owner
Home Financials are based on the most recent Mortgage that was taken out on this home.
Original Mortgage
$184,131
Outstanding Balance
$155,780
Interest Rate
4.04%
Mortgage Type
New Conventional
Estimated Equity
$294,580
Purchase Details
Closed on
Mar 20, 2017
Sold by
Wilson Carole Elizabeth and Wilson Clyde Thomas
Bought by
Browder Elizabeth J and Demere Jon R
Home Financials for this Owner
Home Financials are based on the most recent Mortgage that was taken out on this home.
Original Mortgage
$184,131
Interest Rate
4.19%
Mortgage Type
New Conventional
Create a Home Valuation Report for This Property
The Home Valuation Report is an in-depth analysis detailing your home's value as well as a comparison with similar homes in the area
Home Values in the Area
Average Home Value in this Area
Purchase History
| Date | Buyer | Sale Price | Title Company |
|---|---|---|---|
| Browder Elizabeth J | -- | None Available | |
| Browder Elizabeth J | -- | None Available |
Source: Public Records
Mortgage History
| Date | Status | Borrower | Loan Amount |
|---|---|---|---|
| Open | Browder Elizabeth J | $184,131 | |
| Previous Owner | Browder Elizabeth J | $184,131 |
Source: Public Records
Tax History
| Year | Tax Paid | Tax Assessment Tax Assessment Total Assessment is a certain percentage of the fair market value that is determined by local assessors to be the total taxable value of land and additions on the property. | Land | Improvement |
|---|---|---|---|---|
| 2025 | $1,873 | $395,433 | $77,582 | $317,851 |
| 2024 | $1,873 | $375,662 | $32,610 | $343,052 |
| 2023 | $6,032 | $389,961 | $32,610 | $357,351 |
| 2022 | $6,163 | $317,706 | $23,262 | $294,444 |
| 2021 | $6,000 | $285,982 | $23,262 | $262,720 |
| 2020 | $5,718 | $267,216 | $23,262 | $243,954 |
| 2019 | $5,609 | $256,497 | $21,740 | $234,757 |
| 2018 | $5,360 | $246,446 | $21,740 | $224,706 |
| 2017 | $5,453 | $255,398 | $21,740 | $233,658 |
| 2016 | $5,326 | $249,451 | $21,740 | $227,711 |
| 2015 | $4,814 | $239,723 | $21,740 | $217,983 |
| 2014 | $4,814 | $226,541 | $21,740 | $204,801 |
Source: Public Records
Map
Nearby Homes
- 319 E 1st St
- 1212 Belmont Dr
- 114 E 2nd St
- 520 E Lake St
- 1920 S Sneed Ave
- 1015 S Donnybrook Ave
- 2003 S Jarrell Ave
- 1931 S Wiley Ave
- 2026 S Wall Ave
- 210 Mockingbird Ln
- 2108 S Wall Ave
- 1226 S Fleishel Ave
- 325 W 4th St
- 628 Troup Hwy
- 401 W 4th St
- 204 Lindsey Ln
- 1118 S Fleishel Ave
- 1014 S College Ave
- 315 Mockingbird Ln
- 407 W 6th St
- 512 512 E Third
- 520 E 3rd St
- 520 520 E Third
- 1508 S Wall Ave
- 1428 S Wall Ave
- 519 E 2nd St
- 1522 S Wall Ave
- 521 521 E 2nd St
- 513 E 3rd St
- 521 E 2nd St
- 1522 1522 Wall S
- 517 E 3rd St
- 1414 S Wall Ave
- 602 E 3rd St
- 1521 S Sneed Ave
- 1526 S Wall Ave
- 515 E 2nd St
- 1412 S Sneed Ave
- 1521 1521 S Sneed
- 603 E 2nd St
Your Personal Tour Guide
Ask me questions while you tour the home.