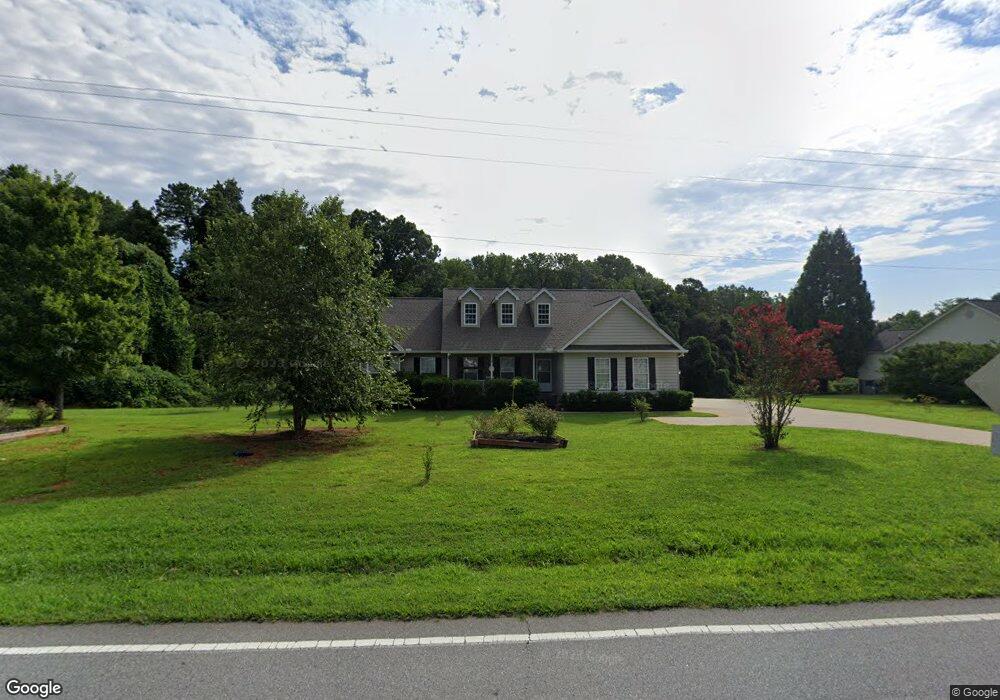
512 E Mountain Creek Rd Taylors, SC 29687
Estimated Value: $406,000 - $519,000
4
Beds
2
Baths
2,274
Sq Ft
$204/Sq Ft
Est. Value
About This Home
This home is located at 512 E Mountain Creek Rd, Taylors, SC 29687 and is currently estimated at $463,736, approximately $203 per square foot. 512 E Mountain Creek Rd is a home located in Greenville County with nearby schools including Paris Elementary School, Sevier Middle, and Wade Hampton High.
Ownership History
Date
Name
Owned For
Owner Type
Purchase Details
Closed on
Jul 6, 2020
Sold by
Swanger Lynn M and Estate Of Carl Anthony Swanger
Bought by
Swanger Lynn M
Current Estimated Value
Home Financials for this Owner
Home Financials are based on the most recent Mortgage that was taken out on this home.
Original Mortgage
$158,500
Outstanding Balance
$140,547
Interest Rate
3.1%
Mortgage Type
New Conventional
Estimated Equity
$323,189
Purchase Details
Closed on
Sep 14, 2006
Sold by
Favart Edward E and Favart Kimberly M
Bought by
Swanger Carl A and Swanger Lynn M
Home Financials for this Owner
Home Financials are based on the most recent Mortgage that was taken out on this home.
Original Mortgage
$30,750
Interest Rate
6.48%
Mortgage Type
Stand Alone Second
Purchase Details
Closed on
Apr 12, 2005
Sold by
Three L'S Inc
Bought by
Favart Edward E
Create a Home Valuation Report for This Property
The Home Valuation Report is an in-depth analysis detailing your home's value as well as a comparison with similar homes in the area
Home Values in the Area
Average Home Value in this Area
Purchase History
| Date | Buyer | Sale Price | Title Company |
|---|---|---|---|
| Swanger Lynn M | -- | None Available | |
| Swanger Carl A | $205,000 | None Available | |
| Favart Edward E | $19,900 | -- |
Source: Public Records
Mortgage History
| Date | Status | Borrower | Loan Amount |
|---|---|---|---|
| Open | Swanger Lynn M | $158,500 | |
| Previous Owner | Swanger Carl A | $30,750 |
Source: Public Records
Tax History Compared to Growth
Tax History
| Year | Tax Paid | Tax Assessment Tax Assessment Total Assessment is a certain percentage of the fair market value that is determined by local assessors to be the total taxable value of land and additions on the property. | Land | Improvement |
|---|---|---|---|---|
| 2024 | $1,923 | $10,290 | $1,380 | $8,910 |
| 2023 | $1,923 | $10,290 | $1,380 | $8,910 |
| 2022 | $1,551 | $10,290 | $1,380 | $8,910 |
| 2021 | $5,022 | $15,430 | $2,070 | $13,360 |
| 2020 | $1,734 | $8,950 | $1,200 | $7,750 |
| 2019 | $1,717 | $8,950 | $1,200 | $7,750 |
| 2018 | $1,800 | $8,950 | $1,200 | $7,750 |
| 2017 | $1,782 | $8,950 | $1,200 | $7,750 |
| 2016 | $1,710 | $223,680 | $30,000 | $193,680 |
| 2015 | $1,693 | $223,680 | $30,000 | $193,680 |
| 2014 | $1,604 | $214,480 | $29,463 | $185,017 |
Source: Public Records
Map
Nearby Homes
- 504 Cypress Links Way
- 6 Apple Jack Ln
- 8 Knoll Cir
- 1810 Reid School Rd
- 10 Kindlin Way
- 1863 Reid School Rd
- 1861 Reid School Rd
- 1859 Reid School Rd
- 29 Kindlin Way
- 305 Beckworth Dr
- 3 Fox Ridge Point
- 8 Overlook Ct
- 28 Bernwood Dr
- 301 Cardinal Dr
- 102 Millbrook Cir
- 8 Tall Tree Ln
- 302 Ledgewood Way
- 2 Cauley Dr Unit 30
- 8 Graystone Way Unit 8
- 585 Mountain Creek Rd
- 508 E Mountain Creek Rd
- 553 E Mountain Creek Rd
- 515 E Mountain Creek Rd
- 504 E Mountain Creek Rd
- 519 E Mountain Creek Rd
- 612 E Mountain Creek Rd
- 501 Cypress Links Way
- 314 Pebble Creek Dr
- 500 Cypress Links Way
- 50 Ponderosa Dr
- 503 Cypress Links Way
- 4 Cricket Ct
- 3702 State Park Rd
- 3608 State Park Rd
- 17 Apple Jack Ln
- 502 Cypress Links Way
- 2 Cricket Ct
- 60 Ponderosa Dr
- 315 Pebble Creek Dr
- 18 Apple Jack Ln