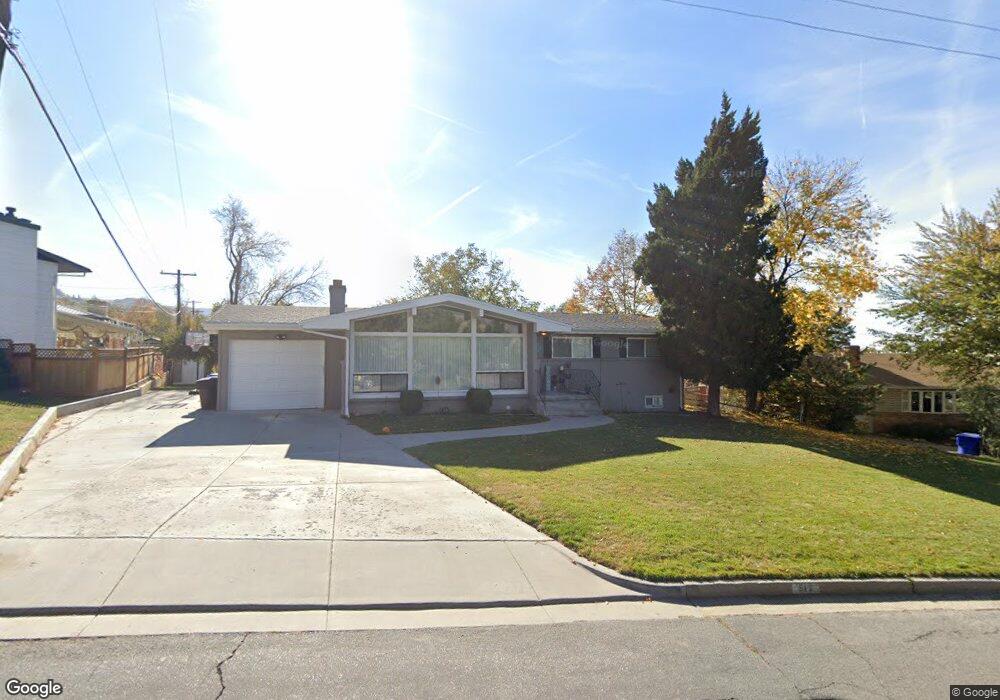
512 Edgehill Dr Bountiful, UT 84010
Estimated Value: $533,869 - $587,000
3
Beds
2
Baths
1,384
Sq Ft
$401/Sq Ft
Est. Value
About This Home
This home is located at 512 Edgehill Dr, Bountiful, UT 84010 and is currently estimated at $555,217, approximately $401 per square foot. 512 Edgehill Dr is a home located in Davis County with nearby schools including Muir School, Mueller Park Junior High School, and Woods Cross High School.
Ownership History
Date
Name
Owned For
Owner Type
Purchase Details
Closed on
Mar 3, 2022
Sold by
Hosman Tamara A
Bought by
Tamara A Hosman Revocable Trust
Current Estimated Value
Purchase Details
Closed on
Aug 11, 2021
Sold by
Hosman Tammie A and Hosman Tamara A
Bought by
Hosman Tamara A
Home Financials for this Owner
Home Financials are based on the most recent Mortgage that was taken out on this home.
Original Mortgage
$347,000
Interest Rate
2.9%
Mortgage Type
New Conventional
Purchase Details
Closed on
Nov 13, 2013
Sold by
Hosman Sean B and Hosman Tammie A
Bought by
Hosman Tammie A
Purchase Details
Closed on
Jun 3, 1997
Sold by
Peterson Wynn D and Peterson Jocelyn W
Bought by
Hosman Sean B D and Hosman Tammie A
Home Financials for this Owner
Home Financials are based on the most recent Mortgage that was taken out on this home.
Original Mortgage
$150,300
Interest Rate
8.08%
Mortgage Type
Balloon
Create a Home Valuation Report for This Property
The Home Valuation Report is an in-depth analysis detailing your home's value as well as a comparison with similar homes in the area
Purchase History
| Date | Buyer | Sale Price | Title Company |
|---|---|---|---|
| Tamara A Hosman Revocable Trust | -- | None Listed On Document | |
| Hosman Tamara A | -- | Meridian Title Company | |
| Hosman Tammie A | -- | None Available | |
| Hosman Sean B D | -- | Associated Title Company |
Source: Public Records
Mortgage History
| Date | Status | Borrower | Loan Amount |
|---|---|---|---|
| Previous Owner | Hosman Tamara A | $347,000 | |
| Previous Owner | Hosman Sean B D | $150,300 |
Source: Public Records
Tax History
| Year | Tax Paid | Tax Assessment Tax Assessment Total Assessment is a certain percentage of the fair market value that is determined by local assessors to be the total taxable value of land and additions on the property. | Land | Improvement |
|---|---|---|---|---|
| 2025 | $3,029 | $271,701 | $140,256 | $131,445 |
| 2024 | $2,808 | $261,249 | $129,214 | $132,035 |
| 2023 | $2,815 | $262,350 | $129,584 | $132,765 |
| 2022 | $2,715 | $457,000 | $228,443 | $228,557 |
| 2021 | $2,436 | $345,000 | $186,856 | $158,144 |
| 2020 | $2,153 | $305,000 | $170,113 | $134,887 |
| 2019 | $2,167 | $300,000 | $164,649 | $135,351 |
| 2018 | $2,029 | $276,000 | $153,344 | $122,656 |
| 2016 | $1,789 | $132,000 | $49,725 | $82,275 |
| 2015 | $1,787 | $124,630 | $49,725 | $74,905 |
| 2014 | $1,706 | $122,280 | $49,725 | $72,555 |
| 2013 | -- | $114,319 | $52,360 | $61,959 |
Source: Public Records
Map
Nearby Homes
- 610 Meadowlark Ln
- 761 San Simeon Way
- 221 E 2450 S
- 2292 S 250 E
- 320 E 2100 S
- 2273 S 200 E
- 831 E San Simeon Way S
- 295 E 2050 S Unit 1
- 742 Chelsea Dr
- 2046 S 350 E Unit 4
- 2038 S 350 E Unit 3
- 2059 S 350 E Unit 6
- 296 E 2050 S Unit 2
- 2136 S 900 E
- 1885 Spring Creek Dr
- 110 2250 S
- 69 E North Canyon Rd
- 19 E North Canyon Rd
- 2156 Elaine Dr
- 2064 S Orchard Dr
Your Personal Tour Guide
Ask me questions while you tour the home.