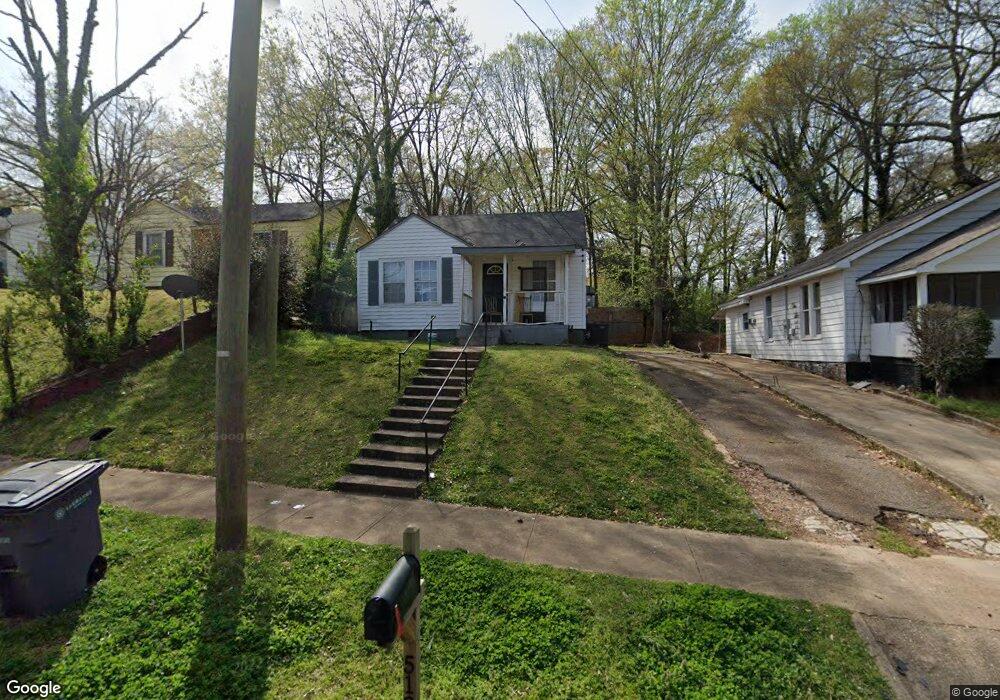
512 Harwell Ave Lagrange, GA 30240
Estimated Value: $59,000 - $168,000
2
Beds
1
Bath
731
Sq Ft
$130/Sq Ft
Est. Value
About This Home
This home is located at 512 Harwell Ave, Lagrange, GA 30240 and is currently estimated at $95,277, approximately $130 per square foot. 512 Harwell Ave is a home located in Troup County with nearby schools including Ethel W. Kight Elementary School, Hollis Hand Elementary School, and Franklin Forest Elementary School.
Ownership History
Date
Name
Owned For
Owner Type
Purchase Details
Closed on
May 17, 2018
Sold by
Thornton Thomasina
Bought by
Graham Tiffany D
Current Estimated Value
Purchase Details
Closed on
Jul 7, 2015
Sold by
Rices Remodeling & Real Es
Bought by
Thornton Thomasina
Purchase Details
Closed on
Dec 4, 1997
Sold by
Lindquist Barbara
Bought by
Jonathan H Arrington
Purchase Details
Closed on
Jul 15, 1989
Sold by
Cleaveland Walter Reuben Etal
Bought by
Lindquist Barbara
Purchase Details
Closed on
Jul 14, 1989
Sold by
Cleaveland Pearlie Mae Cole
Bought by
Cleaveland Walter Reuben Etal
Purchase Details
Closed on
Jan 3, 1983
Sold by
Cole B F
Bought by
Cleaveland Pearlie Mae Cole
Purchase Details
Closed on
Apr 1, 1947
Sold by
Moncus M L
Bought by
Cole B F
Create a Home Valuation Report for This Property
The Home Valuation Report is an in-depth analysis detailing your home's value as well as a comparison with similar homes in the area
Purchase History
| Date | Buyer | Sale Price | Title Company |
|---|---|---|---|
| Graham Tiffany D | $25,000 | -- | |
| Thornton Thomasina | $1,100 | -- | |
| Thornton Thomasina | $1,100 | -- | |
| Jonathan H Arrington | $25,000 | -- | |
| Lindquist Barbara | -- | -- | |
| Cleaveland Walter Reuben Etal | -- | -- | |
| Cleaveland Pearlie Mae Cole | -- | -- | |
| Cole B F | -- | -- |
Source: Public Records
Tax History
| Year | Tax Paid | Tax Assessment Tax Assessment Total Assessment is a certain percentage of the fair market value that is determined by local assessors to be the total taxable value of land and additions on the property. | Land | Improvement |
|---|---|---|---|---|
| 2025 | $656 | $24,040 | $3,160 | $20,880 |
| 2024 | $478 | $17,520 | $3,160 | $14,360 |
| 2023 | $445 | $16,320 | $3,160 | $13,160 |
| 2022 | $437 | $15,640 | $3,160 | $12,480 |
| 2021 | $273 | $9,040 | $3,160 | $5,880 |
| 2020 | $273 | $9,040 | $3,160 | $5,880 |
| 2019 | $257 | $8,520 | $3,160 | $5,360 |
| 2018 | $252 | $8,360 | $3,000 | $5,360 |
| 2017 | $252 | $8,360 | $3,000 | $5,360 |
| 2016 | $245 | $8,122 | $3,000 | $5,122 |
| 2015 | $251 | $8,294 | $3,173 | $5,122 |
| 2014 | $243 | $8,024 | $3,173 | $4,852 |
| 2013 | -- | $10,218 | $3,180 | $7,038 |
Source: Public Records
Map
Nearby Homes
- 207 Wilkes St
- 206 Peachtree St
- 509 S Lewis St
- 505 S Lewis St
- 304 Boulevard
- 416 Park Ave
- 600 Park Ave
- 421 College Ave
- 208 Boulevard
- 405 W Broome St Unit 2
- 405 W Broome St Unit 3
- 405 W Broome St Unit 4
- 405 W Broome St Unit 1
- 405 W Broome St Unit 5
- 119 College Ave
- 501 Milam St
- 914 Todd St
- 812 Elm St
- 606 Poplar St
- 303 E Mulberry St
- 510 Harwell Ave
- 514 Harwell Ave
- 508 Harwell Ave
- 516 Harwell Ave
- 202 Wilkes St
- 518 Harwell Ave
- 506 Harwell Ave
- 513 Alford St
- 511 Alford St
- 504 Harwell Ave
- 511 Harwell Ave
- 515 Alford St
- 507 Harwell Ave
- 509 Alford St
- 513 Harwell Ave
- 204 Wilkes St
- 507 Alford St
- 201 Wilkes St
- 505 Harwell Ave
- 515 Harwell Ave
Your Personal Tour Guide
Ask me questions while you tour the home.