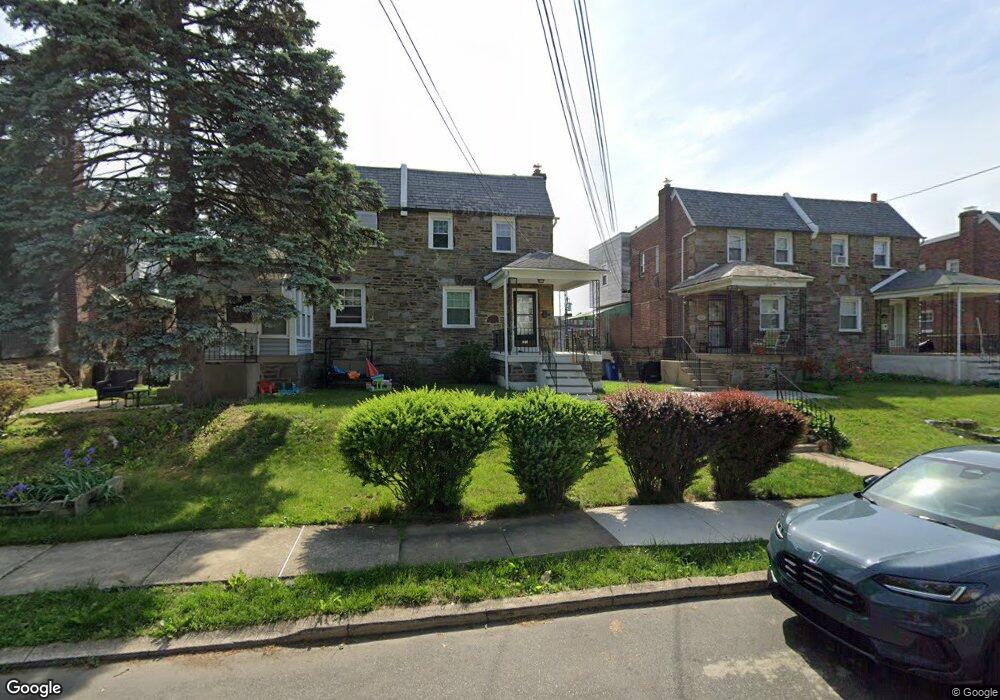
512 Holly Rd Lansdowne, PA 19050
Estimated Value: $197,000 - $244,000
3
Beds
1
Bath
1,328
Sq Ft
$165/Sq Ft
Est. Value
About This Home
This home is located at 512 Holly Rd, Lansdowne, PA 19050 and is currently estimated at $219,313, approximately $165 per square foot. 512 Holly Rd is a home located in Delaware County with nearby schools including Evans Elementary School, Penn Wood Middle School, and Penn Wood High School - Cypress Street Campus.
Ownership History
Date
Name
Owned For
Owner Type
Purchase Details
Closed on
May 10, 2007
Sold by
Hud
Bought by
Nedi Tariku
Current Estimated Value
Home Financials for this Owner
Home Financials are based on the most recent Mortgage that was taken out on this home.
Original Mortgage
$102,000
Interest Rate
6.73%
Mortgage Type
Purchase Money Mortgage
Purchase Details
Closed on
Jun 13, 2006
Sold by
Midfirst Bank
Bought by
Hud
Purchase Details
Closed on
May 24, 2006
Sold by
Steplight Derrick and Mortgage Electronic Registrati
Bought by
Midfirst Bank and Midfirst Bank State Savings Bank
Purchase Details
Closed on
Dec 28, 2001
Sold by
Samar Michael J
Bought by
Steplight Derrick
Home Financials for this Owner
Home Financials are based on the most recent Mortgage that was taken out on this home.
Original Mortgage
$71,900
Interest Rate
6.72%
Mortgage Type
FHA
Create a Home Valuation Report for This Property
The Home Valuation Report is an in-depth analysis detailing your home's value as well as a comparison with similar homes in the area
Home Values in the Area
Average Home Value in this Area
Purchase History
| Date | Buyer | Sale Price | Title Company |
|---|---|---|---|
| Nedi Tariku | $102,000 | First American Title Ins Co | |
| Hud | -- | None Available | |
| Midfirst Bank | -- | None Available | |
| Steplight Derrick | $72,500 | First American Title Ins Co |
Source: Public Records
Mortgage History
| Date | Status | Borrower | Loan Amount |
|---|---|---|---|
| Previous Owner | Nedi Tariku | $102,000 | |
| Previous Owner | Steplight Derrick | $71,900 |
Source: Public Records
Tax History Compared to Growth
Tax History
| Year | Tax Paid | Tax Assessment Tax Assessment Total Assessment is a certain percentage of the fair market value that is determined by local assessors to be the total taxable value of land and additions on the property. | Land | Improvement |
|---|---|---|---|---|
| 2025 | $4,739 | $110,980 | $34,450 | $76,530 |
| 2024 | $4,739 | $110,980 | $34,450 | $76,530 |
| 2023 | $4,304 | $110,980 | $34,450 | $76,530 |
| 2022 | $4,104 | $110,980 | $34,450 | $76,530 |
| 2021 | $6,206 | $110,980 | $34,450 | $76,530 |
| 2020 | $4,138 | $66,260 | $19,880 | $46,380 |
| 2019 | $4,065 | $66,260 | $19,880 | $46,380 |
| 2018 | $4,009 | $66,260 | $0 | $0 |
| 2017 | $3,925 | $66,260 | $0 | $0 |
| 2016 | $364 | $66,260 | $0 | $0 |
| 2015 | $364 | $66,260 | $0 | $0 |
| 2014 | $364 | $66,260 | $0 | $0 |
Source: Public Records
Map
Nearby Homes
- 503 Bonsall Ave
- 417 Holly Rd
- 435 Bonsall Ave
- 407 Church Ln
- 537 Orchard Ave
- 440 Cypress St
- 536 Cypress St
- 530 Orchard Ave
- 545 Brookside Ave
- 619 Cypress St
- 702 Cedar Ave
- 725 Church Ln
- 725 Yeadon Ave
- 740 Church Ln
- 1016 Whitby Ave
- 800 Bullock Ave
- 121 Beverly Ave
- 711 Pembroke Ave
- 608 Pembroke Ave
- 7026 Atlantic Ave