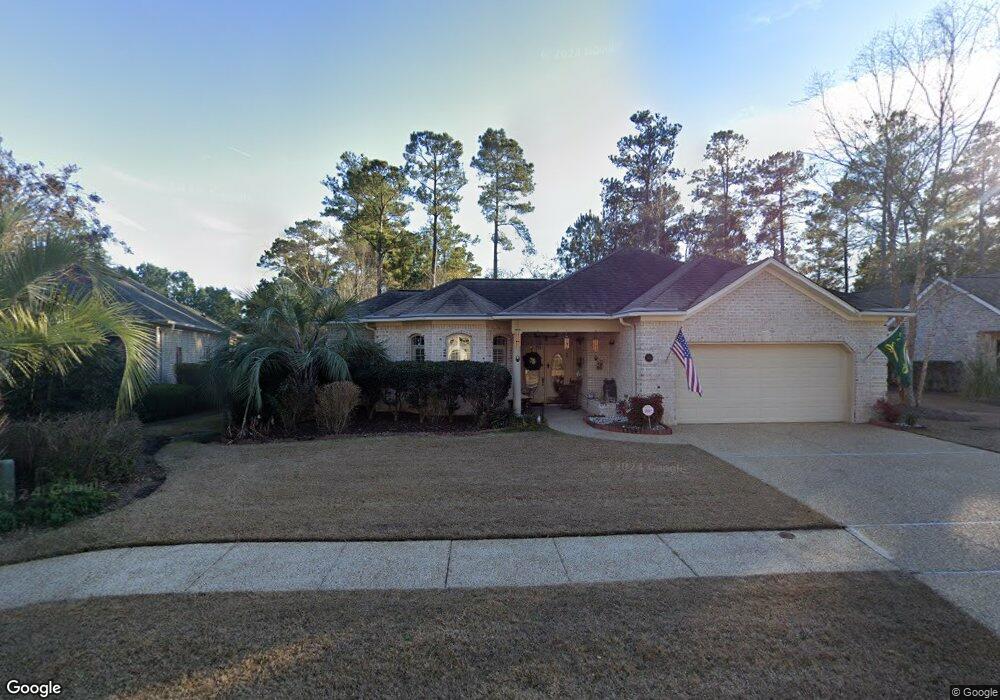
512 Horton Place Winnabow, NC 28479
Estimated Value: $444,514 - $523,000
3
Beds
2
Baths
2,236
Sq Ft
$211/Sq Ft
Est. Value
About This Home
This home is located at 512 Horton Place, Winnabow, NC 28479 and is currently estimated at $470,879, approximately $210 per square foot. 512 Horton Place is a home located in Brunswick County with nearby schools including Belville Elementary School, Leland Middle School, and North Brunswick High School.
Ownership History
Date
Name
Owned For
Owner Type
Purchase Details
Closed on
Apr 19, 2010
Sold by
Masters Burton L and Masters Jolanda
Bought by
Masters Burton Lewis and Masters Jolanda H
Current Estimated Value
Purchase Details
Closed on
Jun 20, 2007
Sold by
Rosbrook Robert C and Rosbrook Judith T
Bought by
Masters Burton L and Master Jolanda
Home Financials for this Owner
Home Financials are based on the most recent Mortgage that was taken out on this home.
Original Mortgage
$330,456
Interest Rate
5.65%
Mortgage Type
VA
Purchase Details
Closed on
Apr 22, 2005
Sold by
Premier Homes Of Wilmington Inc
Bought by
Rosbrook Robert C and Rosbrook Judith T
Home Financials for this Owner
Home Financials are based on the most recent Mortgage that was taken out on this home.
Original Mortgage
$298,775
Interest Rate
5.87%
Mortgage Type
Adjustable Rate Mortgage/ARM
Create a Home Valuation Report for This Property
The Home Valuation Report is an in-depth analysis detailing your home's value as well as a comparison with similar homes in the area
Home Values in the Area
Average Home Value in this Area
Purchase History
| Date | Buyer | Sale Price | Title Company |
|---|---|---|---|
| Masters Burton Lewis | -- | None Available | |
| Masters Burton L | $320,000 | None Available | |
| Rosbrook Robert C | $69,500 | None Available |
Source: Public Records
Mortgage History
| Date | Status | Borrower | Loan Amount |
|---|---|---|---|
| Previous Owner | Masters Burton L | $330,456 | |
| Previous Owner | Rosbrook Robert C | $298,775 |
Source: Public Records
Tax History Compared to Growth
Tax History
| Year | Tax Paid | Tax Assessment Tax Assessment Total Assessment is a certain percentage of the fair market value that is determined by local assessors to be the total taxable value of land and additions on the property. | Land | Improvement |
|---|---|---|---|---|
| 2025 | -- | $426,310 | $55,000 | $371,310 |
| 2024 | $3,009 | $426,310 | $55,000 | $371,310 |
| 2023 | $0 | $426,310 | $55,000 | $371,310 |
| 2022 | $0 | $291,600 | $45,000 | $246,600 |
| 2021 | $1,991 | $291,600 | $45,000 | $246,600 |
| 2020 | $0 | $291,600 | $45,000 | $246,600 |
| 2019 | $2,327 | $45,930 | $45,000 | $930 |
| 2018 | $2,112 | $41,120 | $40,000 | $1,120 |
| 2017 | $2,112 | $41,120 | $40,000 | $1,120 |
| 2016 | $1,991 | $41,120 | $40,000 | $1,120 |
| 2015 | $1,905 | $267,930 | $40,000 | $227,930 |
| 2014 | $1,758 | $262,342 | $50,000 | $212,342 |
Source: Public Records
Map
Nearby Homes
- 707 Beachwalk Dr
- 745 Beachwalk Dr
- 9898 Black Bear Hollow SE
- 796 Beachwalk Dr
- 199 Tylers Cove Way
- 207 N Palm Dr
- 195 N Palm Dr
- 2197 N Palm Dr
- 1105 Avebury Ct
- 1206 Birkdale Dr
- 10165 Creekside Dr SE Unit 1
- 10167 Creekside Dr Unit 2
- 1228 Liberty Landing Rd SE
- 136 N Palm Dr
- 106 Kellerton Ct
- Cypress Plan at Mallory Creek - Townhomes at Mallory Creek
- 130 Jansen Ln
- 134 Jansen Ln
- 511 Heartwood Dr
- 368 St Kitts Way
- 514 Horton Place
- 508 Horton Place
- 513 Horton Place
- 426 Avenshire Ct Unit 211
- 511 Horton Place
- 424 Avenshire Ct Unit 210
- 509 Horton Place
- 506 Horton Place
- 602 Viceroy Ct
- 420 Avenshire Ct Unit 209
- 131 Viceroy Ct
- 507 Horton Place
- 602 Viceroy Ct
- 417 Avenshire Ct
- 418 Avenshire Ct Unit 208
- 416 Avenshire Ct Unit 207
- 415 Avenshire Ct
- 414 Avenshire Ct Unit 206
- 413 Avenshire Ct
- 505 Horton Place