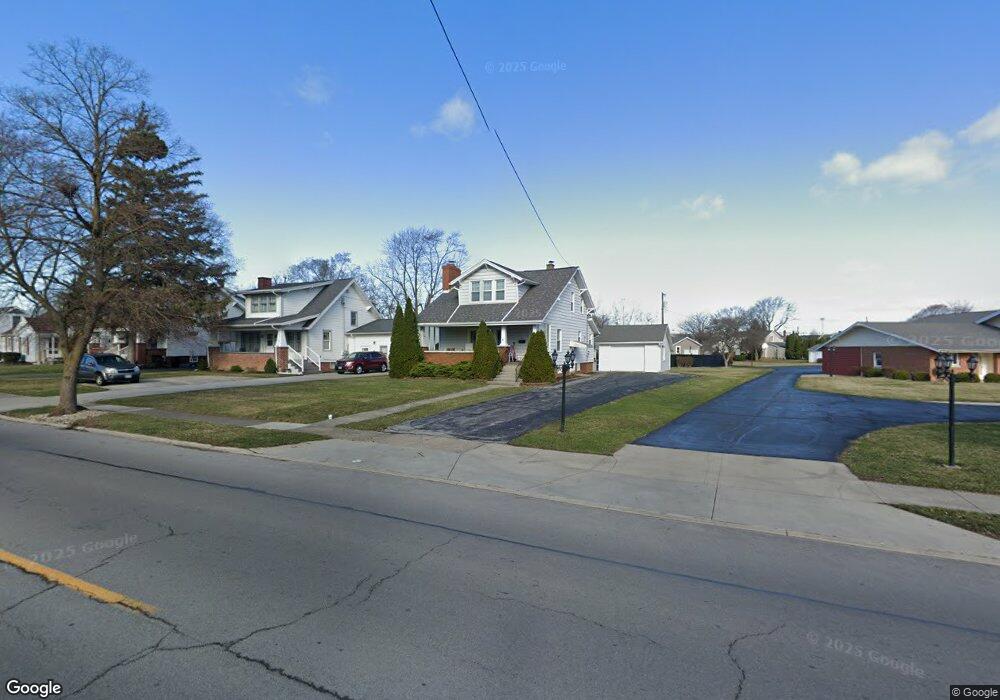
512 Lima Ave Findlay, OH 45840
Estimated Value: $175,000 - $256,000
Studio
2
Baths
1,092
Sq Ft
$182/Sq Ft
Est. Value
About This Home
This home is located at 512 Lima Ave, Findlay, OH 45840 and is currently estimated at $198,279, approximately $181 per square foot. 512 Lima Ave is a home located in Hancock County with nearby schools including Lincoln Elementary School, Donnell Middle School, and Findlay High School.
Ownership History
Date
Name
Owned For
Owner Type
Purchase Details
Closed on
Aug 14, 2025
Sold by
Schuck Susan Rena and Schuck Noel
Bought by
Behnke Jack W
Current Estimated Value
Purchase Details
Closed on
Apr 23, 2025
Sold by
Kirkpatrick-Hawkins Funeral Home Inc and Kirkpatrick-Behnke Funeral Home Inc
Bought by
Saac Realty Llc
Home Financials for this Owner
Home Financials are based on the most recent Mortgage that was taken out on this home.
Original Mortgage
$250,000
Interest Rate
6.65%
Mortgage Type
New Conventional
Create a Home Valuation Report for This Property
The Home Valuation Report is an in-depth analysis detailing your home's value as well as a comparison with similar homes in the area
Home Values in the Area
Average Home Value in this Area
Purchase History
| Date | Buyer | Sale Price | Title Company |
|---|---|---|---|
| Behnke Jack W | $100,000 | None Listed On Document | |
| Saac Realty Llc | $250,000 | None Listed On Document | |
| Saac Realty Llc | $250,000 | None Listed On Document |
Source: Public Records
Mortgage History
| Date | Status | Borrower | Loan Amount |
|---|---|---|---|
| Previous Owner | Saac Realty Llc | $250,000 |
Source: Public Records
Tax History
| Year | Tax Paid | Tax Assessment Tax Assessment Total Assessment is a certain percentage of the fair market value that is determined by local assessors to be the total taxable value of land and additions on the property. | Land | Improvement |
|---|---|---|---|---|
| 2024 | $1,752 | $49,330 | $7,000 | $42,330 |
| 2023 | $1,755 | $49,330 | $7,000 | $42,330 |
| 2022 | $1,749 | $49,330 | $7,000 | $42,330 |
| 2021 | $1,512 | $37,140 | $7,180 | $29,960 |
| 2020 | $1,511 | $37,140 | $7,180 | $29,960 |
| 2019 | $1,481 | $37,140 | $7,180 | $29,960 |
| 2018 | $1,296 | $29,820 | $5,740 | $24,080 |
| 2017 | $1,297 | $29,820 | $5,740 | $24,080 |
| 2016 | $1,286 | $29,820 | $5,740 | $24,080 |
| 2015 | $1,093 | $25,000 | $5,500 | $19,500 |
| 2014 | $1,093 | $25,000 | $5,500 | $19,500 |
| 2012 | $1,102 | $25,000 | $5,500 | $19,500 |
Source: Public Records
Map
Nearby Homes
- 423 Elm St
- 860 Hurd Ave
- 412 Lima Ave
- 1113 Hurd Ave
- 845 Hurd Ave
- 815 Liberty St
- 324 W Mcpherson Ave
- 865 S Main St
- 514 Liberty St
- 527 W Sandusky St
- 216 1st St
- 123 Glendale Ave
- 829 Maple Ave
- 206 Greenlawn Ave
- 807 W Main Cross St
- 608 W Front St
- 407 Washington St
- 1604 Gray St
- 315 Fairlawn Place
- 1401 Logan Ave
Your Personal Tour Guide
Ask me questions while you tour the home.