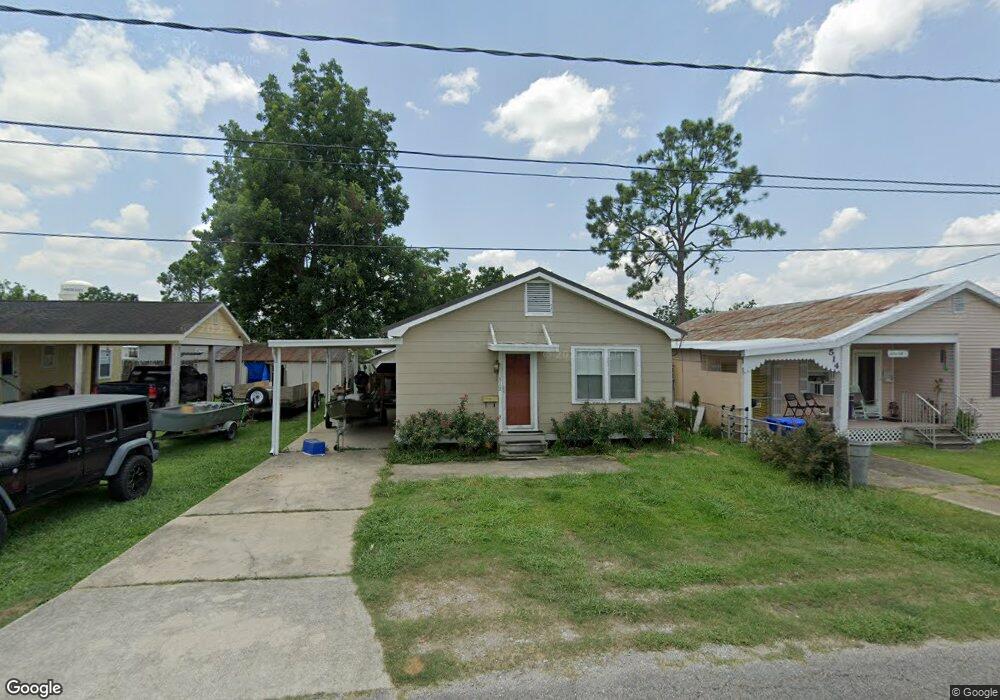
512 Maple St Thibodaux, LA 70301
Estimated Value: $132,438 - $154,000
2
Beds
1
Bath
1,084
Sq Ft
$131/Sq Ft
Est. Value
About This Home
This home is located at 512 Maple St, Thibodaux, LA 70301 and is currently estimated at $141,610, approximately $130 per square foot. 512 Maple St is a home located in Lafourche Parish with nearby schools including C.M. Washington Elementary School, West Thibodaux Middle School, and Thibodaux High School.
Ownership History
Date
Name
Owned For
Owner Type
Purchase Details
Closed on
Feb 21, 2020
Sold by
Thibodeaux Jennifer A
Bought by
Perk Zachary A
Current Estimated Value
Home Financials for this Owner
Home Financials are based on the most recent Mortgage that was taken out on this home.
Original Mortgage
$116,161
Outstanding Balance
$102,852
Interest Rate
3.6%
Mortgage Type
New Conventional
Estimated Equity
$38,758
Purchase Details
Closed on
Nov 13, 2014
Sold by
Boudreaux Beverly Landry and Herbert Elaine Landry
Bought by
Thibodaux Jennifer A
Home Financials for this Owner
Home Financials are based on the most recent Mortgage that was taken out on this home.
Original Mortgage
$93,163
Interest Rate
4.21%
Mortgage Type
New Conventional
Purchase Details
Closed on
Dec 5, 2013
Sold by
Landry Wilbert
Bought by
Hebert Elaine Landry and Landry Wilbert Jean
Create a Home Valuation Report for This Property
The Home Valuation Report is an in-depth analysis detailing your home's value as well as a comparison with similar homes in the area
Home Values in the Area
Average Home Value in this Area
Purchase History
| Date | Buyer | Sale Price | Title Company |
|---|---|---|---|
| Perk Zachary A | $115,000 | None Available | |
| Thibodaux Jennifer A | $90,000 | None Available | |
| Hebert Elaine Landry | $36,000 | None Available |
Source: Public Records
Mortgage History
| Date | Status | Borrower | Loan Amount |
|---|---|---|---|
| Open | Perk Zachary A | $116,161 | |
| Previous Owner | Thibodaux Jennifer A | $93,163 |
Source: Public Records
Tax History Compared to Growth
Tax History
| Year | Tax Paid | Tax Assessment Tax Assessment Total Assessment is a certain percentage of the fair market value that is determined by local assessors to be the total taxable value of land and additions on the property. | Land | Improvement |
|---|---|---|---|---|
| 2023 | $90 | $8,410 | $1,000 | $7,410 |
| 2022 | $808 | $8,410 | $1,000 | $7,410 |
| 2021 | $784 | $8,410 | $1,000 | $7,410 |
| 2020 | $792 | $8,410 | $1,000 | $7,410 |
| 2019 | $766 | $8,100 | $700 | $7,400 |
| 2018 | $767 | $8,100 | $700 | $7,400 |
| 2017 | $881 | $8,100 | $700 | $7,400 |
| 2016 | $56 | $8,100 | $700 | $7,400 |
| 2015 | $765 | $8,100 | $0 | $0 |
| 2014 | $559 | $5,900 | $0 | $0 |
| 2013 | $559 | $5,900 | $0 | $0 |
Source: Public Records
Map
Nearby Homes