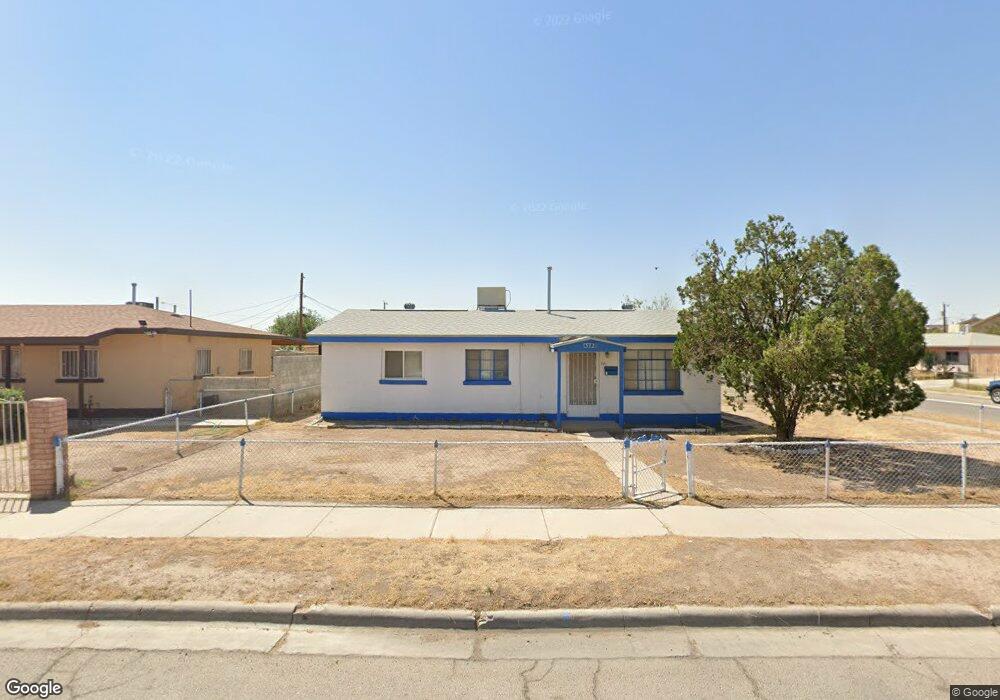
512 Montecito Rd El Paso, TX 79915
Santa Lucia NeighborhoodEstimated Value: $136,000 - $147,000
3
Beds
1
Bath
960
Sq Ft
$145/Sq Ft
Est. Value
About This Home
This home is located at 512 Montecito Rd, El Paso, TX 79915 and is currently estimated at $138,940, approximately $144 per square foot. 512 Montecito Rd is a home located in El Paso County with nearby schools including North Loop Elementary School, Bel Air Middle, and Bel Air High School.
Ownership History
Date
Name
Owned For
Owner Type
Purchase Details
Closed on
Feb 5, 2021
Sold by
Martinez Ruben
Bought by
Martinez Ruben and Martinez Ruben
Current Estimated Value
Purchase Details
Closed on
Nov 5, 2003
Sold by
Lopez Juanita E and Martinez Josefina
Bought by
Martinez Ruben
Home Financials for this Owner
Home Financials are based on the most recent Mortgage that was taken out on this home.
Original Mortgage
$33,750
Outstanding Balance
$3,765
Interest Rate
5.14%
Mortgage Type
New Conventional
Estimated Equity
$135,175
Purchase Details
Closed on
May 31, 1995
Sold by
Raisch Paul C and Raisch Maria G
Bought by
Martinez Q Ruben
Home Financials for this Owner
Home Financials are based on the most recent Mortgage that was taken out on this home.
Original Mortgage
$45,500
Interest Rate
7.79%
Mortgage Type
Seller Take Back
Create a Home Valuation Report for This Property
The Home Valuation Report is an in-depth analysis detailing your home's value as well as a comparison with similar homes in the area
Home Values in the Area
Average Home Value in this Area
Purchase History
| Date | Buyer | Sale Price | Title Company |
|---|---|---|---|
| Martinez Ruben | -- | None Available | |
| Martinez Ruben | -- | None Available | |
| Martinez Q Ruben | -- | -- |
Source: Public Records
Mortgage History
| Date | Status | Borrower | Loan Amount |
|---|---|---|---|
| Open | Martinez Ruben | $33,750 | |
| Closed | Martinez Q Ruben | $45,500 |
Source: Public Records
Tax History Compared to Growth
Tax History
| Year | Tax Paid | Tax Assessment Tax Assessment Total Assessment is a certain percentage of the fair market value that is determined by local assessors to be the total taxable value of land and additions on the property. | Land | Improvement |
|---|---|---|---|---|
| 2025 | $1,198 | $91,300 | -- | -- |
| 2024 | $1,198 | $83,000 | $13,053 | $69,947 |
| 2023 | $1,250 | $80,651 | $13,053 | $67,598 |
| 2022 | $2,505 | $80,651 | $13,053 | $67,598 |
| 2021 | $2,345 | $72,152 | $13,053 | $59,099 |
| 2020 | $2,457 | $77,796 | $13,053 | $64,743 |
| 2018 | $2,501 | $80,522 | $13,053 | $67,469 |
| 2017 | $2,235 | $73,104 | $13,053 | $60,051 |
| 2016 | $2,235 | $73,104 | $13,053 | $60,051 |
| 2015 | $772 | $73,104 | $13,053 | $60,051 |
| 2014 | $772 | $74,482 | $13,053 | $61,429 |
Source: Public Records
Map
Nearby Homes
- 525 Lafayette Dr
- 7909 La Jolla Dr
- 7921 Lirio Rd
- 405 Lafayette Dr
- 537 Emerson St
- 7937 San Paulo Dr
- 7907 Alameda Ave
- 8138 Saint Andrew Ln Unit ABCD
- 7928 Hermosillo Dr
- 7798 Rosedale St
- 7800 Hermosillo Dr
- 7655 Hacienda Ave
- 227 Galvan Place
- 8004 Gilbert Dr
- 812 Santa Barbara Dr
- 423 N Carolina Dr
- 1121 Stanley St
- 8181 Staghorn Dr
- 7807 Porche St
- 1004 Atwood Dr
- 514 Montecito Rd
- 7863 Clover Way
- 7858 Clover Way
- 518 Montecito Rd
- 7867 Clover Way
- 7864 Trimona Way
- 511 Montecito Rd
- 513 Montecito Rd
- 7864 Clover Way
- 7868 Trimona Way
- 515 Montecito Rd
- 7871 Clover Way
- 7868 Clover Way
- 517 Montecito Rd
- 7872 Trimona Way
- 7872 Clover Way
- 522 Montecito Rd
- 7875 Clover Way
- 519 Montecito Rd
- 425 Gallagher St