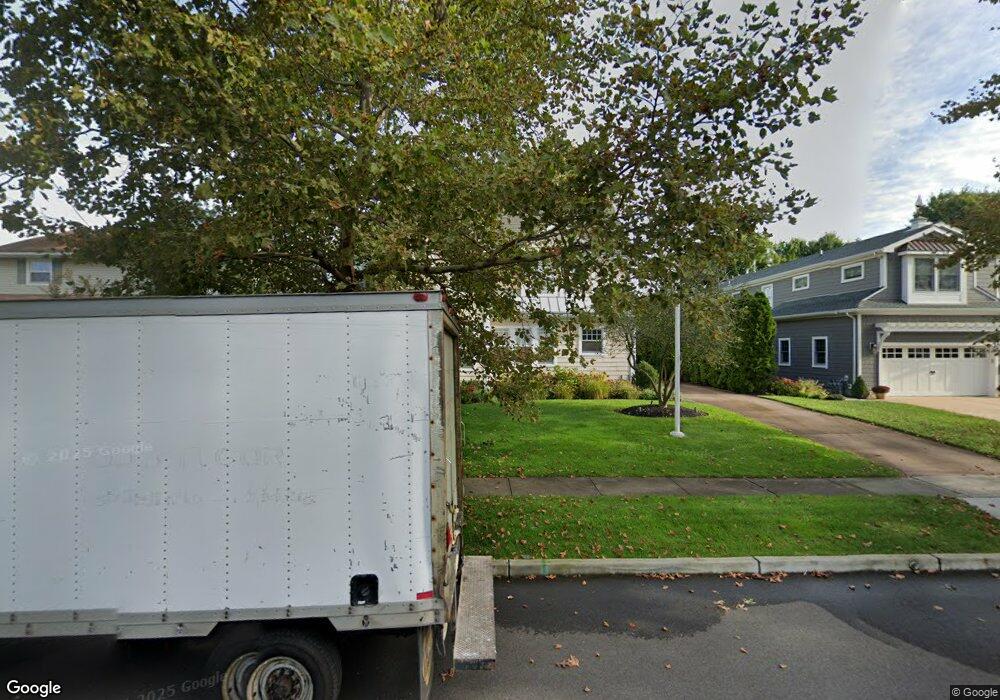
512 Morris Ave Unit *(2024 Summer) Spring Lake, NJ 07762
Estimated Value: $3,480,000 - $3,870,000
4
Beds
5
Baths
4,132
Sq Ft
$905/Sq Ft
Est. Value
About This Home
This home is located at 512 Morris Ave Unit *(2024 Summer), Spring Lake, NJ 07762 and is currently estimated at $3,737,883, approximately $904 per square foot. 512 Morris Ave Unit *(2024 Summer) is a home located in Monmouth County with nearby schools including St. Catharine School.
Ownership History
Date
Name
Owned For
Owner Type
Purchase Details
Closed on
Jun 19, 2025
Sold by
Dunn Peter and Campbell Becky
Bought by
Campbell Becky Gaffney
Current Estimated Value
Purchase Details
Closed on
Jun 29, 2021
Sold by
Eckert Anthony W and Eckert Joanna
Bought by
Dunn Peter and Campbell Becky
Home Financials for this Owner
Home Financials are based on the most recent Mortgage that was taken out on this home.
Original Mortgage
$2,000,000
Interest Rate
2%
Mortgage Type
New Conventional
Purchase Details
Closed on
May 16, 2000
Sold by
Mcnelley Susan Fetix
Bought by
Eckert Anthony and Eckert Joanne
Create a Home Valuation Report for This Property
The Home Valuation Report is an in-depth analysis detailing your home's value as well as a comparison with similar homes in the area
Home Values in the Area
Average Home Value in this Area
Purchase History
| Date | Buyer | Sale Price | Title Company |
|---|---|---|---|
| Campbell Becky Gaffney | -- | None Listed On Document | |
| Campbell Becky Gaffney | -- | None Listed On Document | |
| Dunn Peter | $2,500,000 | Trident Abstract Ttl Agcy Ll | |
| Eckert Anthony | $490,000 | -- |
Source: Public Records
Mortgage History
| Date | Status | Borrower | Loan Amount |
|---|---|---|---|
| Previous Owner | Dunn Peter | $2,000,000 |
Source: Public Records
Tax History Compared to Growth
Tax History
| Year | Tax Paid | Tax Assessment Tax Assessment Total Assessment is a certain percentage of the fair market value that is determined by local assessors to be the total taxable value of land and additions on the property. | Land | Improvement |
|---|---|---|---|---|
| 2025 | $13,474 | $3,049,200 | $1,535,000 | $1,514,200 |
| 2024 | $12,747 | $2,755,500 | $1,416,300 | $1,339,200 |
| 2023 | $12,747 | $2,534,200 | $1,226,300 | $1,307,900 |
| 2022 | $10,330 | $2,113,700 | $1,095,200 | $1,018,500 |
| 2021 | $10,344 | $1,721,700 | $790,200 | $931,500 |
| 2020 | $10,352 | $1,675,000 | $769,900 | $905,100 |
| 2019 | $10,357 | $1,643,900 | $755,300 | $888,600 |
| 2018 | $10,425 | $1,660,100 | $755,300 | $904,800 |
| 2017 | $10,081 | $1,610,400 | $755,300 | $855,100 |
| 2016 | $12,606 | $1,845,700 | $750,200 | $1,095,500 |
| 2015 | $12,754 | $1,827,200 | $731,700 | $1,095,500 |
| 2014 | $12,378 | $1,804,400 | $708,900 | $1,095,500 |
Source: Public Records
Map
Nearby Homes
- 613 Warren Ave
- 513 Mercer Ave
- 15 Wyckham Rd
- 12 Wyckham Rd
- 418 Monmouth Ave
- 118 Warren Ave
- 1905 3rd Ave
- 530 Highway 71 Unit 4
- 200 Monmouth Ave Unit 21
- 200 Monmouth Ave Unit 19
- 200 Monmouth Ave Unit 27
- 200 Monmouth Ave Unit 23
- 200 Monmouth Ave Unit 5
- 418 Salem Ave
- 20 Sussex Ave
- 16 Sussex Ave
- 905 Wall Rd
- 19 Willow Ln
- 305 4th Ave
- 306 Ocean Rd