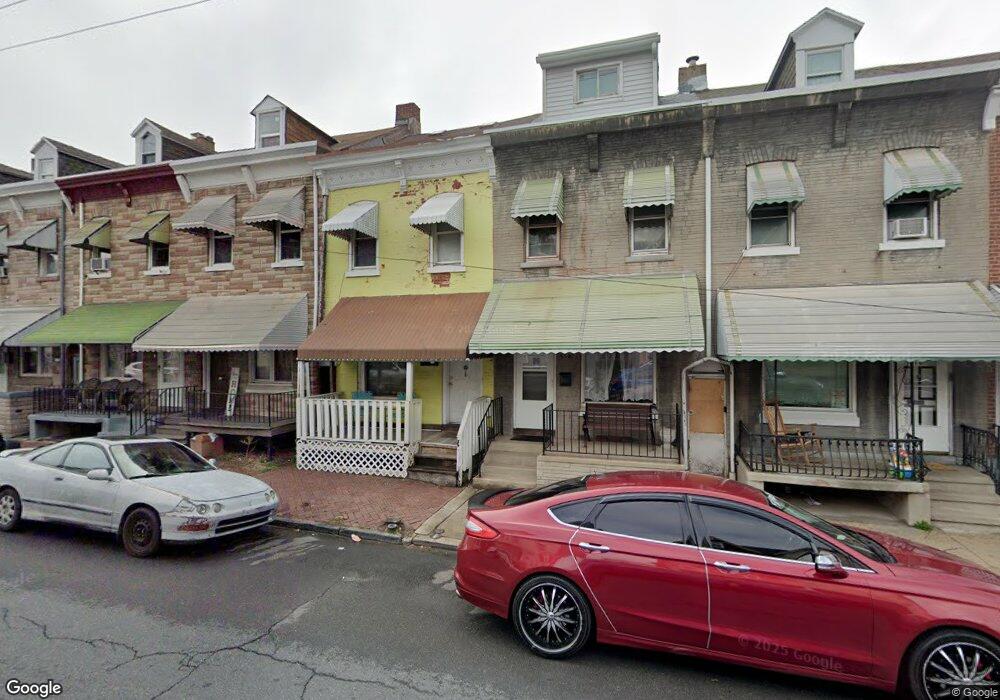
512 N 11th St Reading, PA 19604
Southeast Reading NeighborhoodEstimated Value: $106,644 - $193,000
4
Beds
2
Baths
1,440
Sq Ft
$104/Sq Ft
Est. Value
About This Home
This home is located at 512 N 11th St, Reading, PA 19604 and is currently estimated at $150,411, approximately $104 per square foot. 512 N 11th St is a home located in Berks County with nearby schools including Tenth & Green El School, Central Middle School, and Reading Senior High School.
Ownership History
Date
Name
Owned For
Owner Type
Purchase Details
Closed on
Sep 10, 2009
Sold by
Kings Investment Company Lp
Bought by
Acosta Pascual Lopez
Current Estimated Value
Home Financials for this Owner
Home Financials are based on the most recent Mortgage that was taken out on this home.
Original Mortgage
$14,113
Interest Rate
4.69%
Mortgage Type
Unknown
Purchase Details
Closed on
Apr 28, 2008
Sold by
Riegel Michael D
Bought by
Kings Investment Company Lp
Purchase Details
Closed on
Sep 18, 2007
Sold by
Wanner Margaret E
Bought by
Riegel Michael D
Create a Home Valuation Report for This Property
The Home Valuation Report is an in-depth analysis detailing your home's value as well as a comparison with similar homes in the area
Home Values in the Area
Average Home Value in this Area
Purchase History
| Date | Buyer | Sale Price | Title Company |
|---|---|---|---|
| Acosta Pascual Lopez | $56,547 | First American Title Insuran | |
| Kings Investment Company Lp | $39,000 | None Available | |
| Riegel Michael D | $15,000 | None Available |
Source: Public Records
Mortgage History
| Date | Status | Borrower | Loan Amount |
|---|---|---|---|
| Closed | Acosta Pascual Lopez | $14,113 | |
| Open | Acosta Pascual Lopez | $45,236 |
Source: Public Records
Tax History
| Year | Tax Paid | Tax Assessment Tax Assessment Total Assessment is a certain percentage of the fair market value that is determined by local assessors to be the total taxable value of land and additions on the property. | Land | Improvement |
|---|---|---|---|---|
| 2025 | $668 | $24,600 | $13,000 | $11,600 |
| 2024 | $1,092 | $24,600 | $13,000 | $11,600 |
| 2023 | $1,075 | $24,600 | $13,000 | $11,600 |
| 2022 | $1,075 | $24,600 | $13,000 | $11,600 |
| 2021 | $1,075 | $24,600 | $13,000 | $11,600 |
| 2020 | $1,065 | $24,600 | $13,000 | $11,600 |
| 2019 | $1,065 | $24,600 | $13,000 | $11,600 |
| 2018 | $1,065 | $24,600 | $13,000 | $11,600 |
| 2017 | $1,058 | $24,600 | $13,000 | $11,600 |
| 2016 | $604 | $24,600 | $13,000 | $11,600 |
| 2015 | $604 | $24,600 | $13,000 | $11,600 |
| 2014 | $556 | $24,600 | $13,000 | $11,600 |
Source: Public Records
Map
Nearby Homes
Your Personal Tour Guide
Ask me questions while you tour the home.