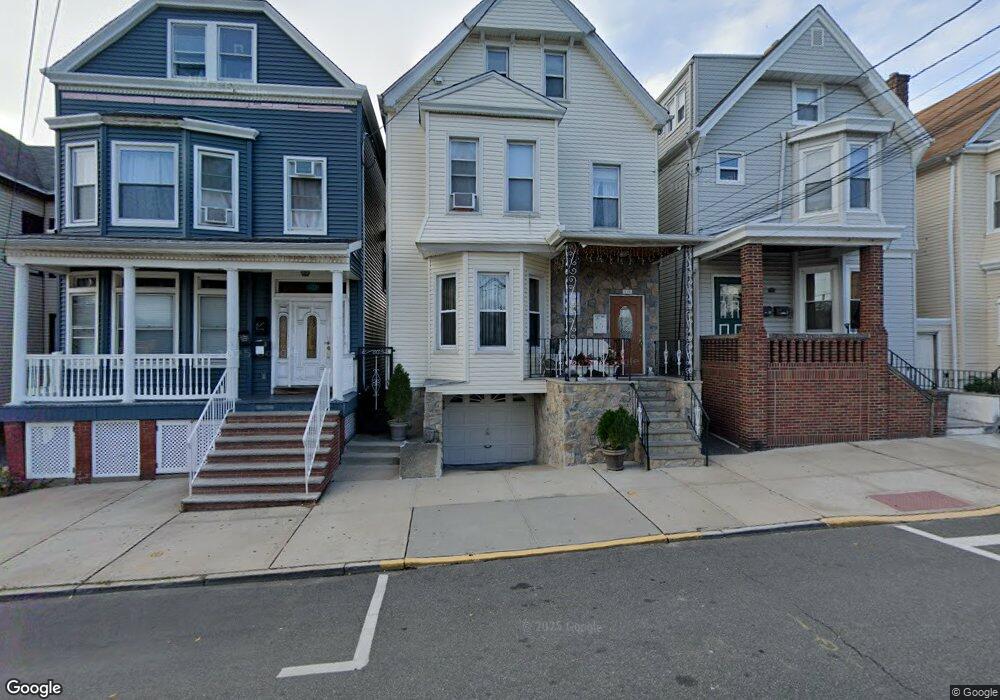
512 N 3rd St East Newark, NJ 07029
Estimated Value: $584,000 - $761,000
--
Bed
--
Bath
2,576
Sq Ft
$256/Sq Ft
Est. Value
About This Home
This home is located at 512 N 3rd St, East Newark, NJ 07029 and is currently estimated at $658,817, approximately $255 per square foot. 512 N 3rd St is a home located in Hudson County with nearby schools including East Newark Public School, Kearny Christian Academy, and Marwah Academy.
Ownership History
Date
Name
Owned For
Owner Type
Purchase Details
Closed on
Jun 7, 1999
Sold by
Poznar Bonnie and Mcgovern Diane
Bought by
Figueiredo Jose P and Figueiredo Maria J
Current Estimated Value
Home Financials for this Owner
Home Financials are based on the most recent Mortgage that was taken out on this home.
Original Mortgage
$145,000
Interest Rate
6.99%
Mortgage Type
Stand Alone First
Purchase Details
Closed on
Jun 13, 1998
Sold by
Kimszal Zofia
Bought by
Poznar Bonnie and Mcgovern Diane
Create a Home Valuation Report for This Property
The Home Valuation Report is an in-depth analysis detailing your home's value as well as a comparison with similar homes in the area
Home Values in the Area
Average Home Value in this Area
Purchase History
| Date | Buyer | Sale Price | Title Company |
|---|---|---|---|
| Figueiredo Jose P | $185,000 | -- | |
| Poznar Bonnie | -- | -- |
Source: Public Records
Mortgage History
| Date | Status | Borrower | Loan Amount |
|---|---|---|---|
| Closed | Figueiredo Jose P | $145,000 |
Source: Public Records
Tax History Compared to Growth
Tax History
| Year | Tax Paid | Tax Assessment Tax Assessment Total Assessment is a certain percentage of the fair market value that is determined by local assessors to be the total taxable value of land and additions on the property. | Land | Improvement |
|---|---|---|---|---|
| 2025 | $9,129 | $308,100 | $62,500 | $245,600 |
| 2024 | $8,661 | $308,100 | $62,500 | $245,600 |
| 2023 | $8,661 | $308,100 | $62,500 | $245,600 |
| 2022 | $8,414 | $308,100 | $62,500 | $245,600 |
| 2021 | $8,371 | $308,100 | $62,500 | $245,600 |
| 2020 | $8,032 | $308,100 | $62,500 | $245,600 |
| 2019 | $8,035 | $308,100 | $62,500 | $245,600 |
| 2018 | $7,878 | $308,100 | $62,500 | $245,600 |
| 2017 | $7,807 | $308,100 | $62,500 | $245,600 |
| 2016 | $6,423 | $69,600 | $15,000 | $54,600 |
| 2015 | $6,309 | $69,600 | $15,000 | $54,600 |
| 2014 | $6,343 | $69,600 | $15,000 | $54,600 |
Source: Public Records
Map
Nearby Homes