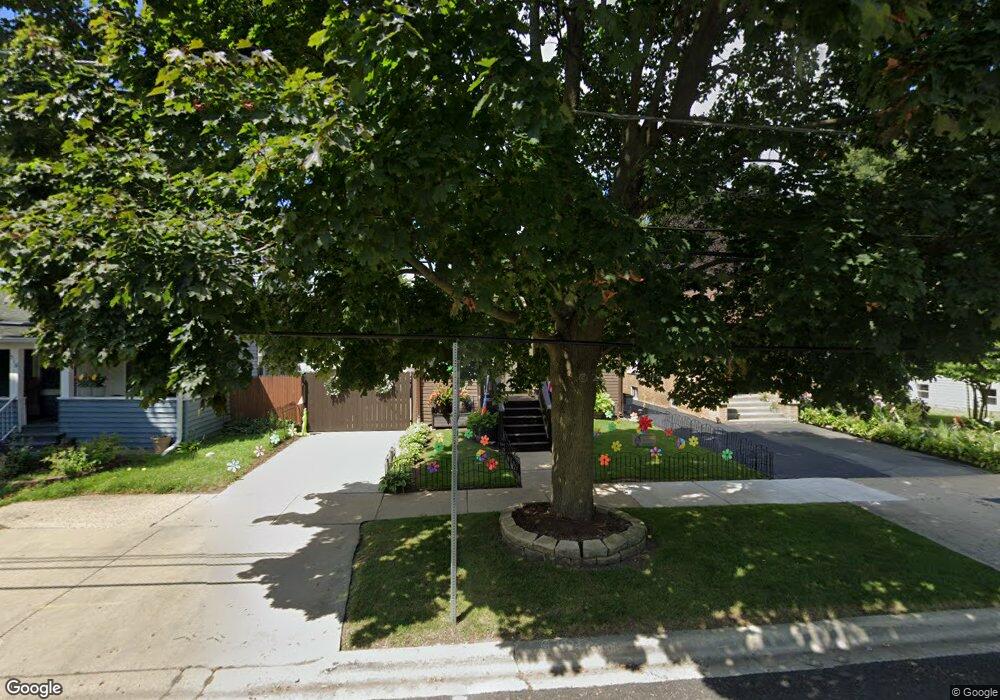
512 N Ash St Waukegan, IL 60085
Estimated Value: $160,000 - $243,000
2
Beds
1
Bath
822
Sq Ft
$236/Sq Ft
Est. Value
About This Home
This home is located at 512 N Ash St, Waukegan, IL 60085 and is currently estimated at $193,908, approximately $235 per square foot. 512 N Ash St is a home located in Lake County with nearby schools including Edith M Smith Middle School, Waukegan High School, and LEARN John & Kathy Schreiber Campus.
Ownership History
Date
Name
Owned For
Owner Type
Purchase Details
Closed on
Apr 5, 2002
Sold by
Santana Virgilio and Santana Raul
Bought by
Guzman Miguel A
Current Estimated Value
Home Financials for this Owner
Home Financials are based on the most recent Mortgage that was taken out on this home.
Original Mortgage
$98,911
Outstanding Balance
$42,259
Interest Rate
7.24%
Mortgage Type
FHA
Estimated Equity
$151,649
Create a Home Valuation Report for This Property
The Home Valuation Report is an in-depth analysis detailing your home's value as well as a comparison with similar homes in the area
Home Values in the Area
Average Home Value in this Area
Purchase History
| Date | Buyer | Sale Price | Title Company |
|---|---|---|---|
| Guzman Miguel A | $100,500 | -- |
Source: Public Records
Mortgage History
| Date | Status | Borrower | Loan Amount |
|---|---|---|---|
| Open | Guzman Miguel A | $98,911 |
Source: Public Records
Tax History Compared to Growth
Tax History
| Year | Tax Paid | Tax Assessment Tax Assessment Total Assessment is a certain percentage of the fair market value that is determined by local assessors to be the total taxable value of land and additions on the property. | Land | Improvement |
|---|---|---|---|---|
| 2024 | $3,412 | $40,413 | $6,108 | $34,305 |
| 2023 | $3,201 | $36,182 | $5,468 | $30,714 |
| 2022 | $3,201 | $32,744 | $5,200 | $27,544 |
| 2021 | $2,947 | $28,271 | $4,640 | $23,631 |
| 2020 | $2,986 | $26,338 | $4,323 | $22,015 |
| 2019 | $3,005 | $24,134 | $3,961 | $20,173 |
| 2018 | $2,893 | $22,375 | $5,045 | $17,330 |
| 2017 | $2,816 | $19,795 | $4,463 | $15,332 |
| 2016 | $2,658 | $17,201 | $3,878 | $13,323 |
| 2015 | $2,601 | $15,395 | $3,471 | $11,924 |
| 2014 | $2,279 | $13,471 | $2,914 | $10,557 |
| 2012 | $3,091 | $14,596 | $3,157 | $11,439 |
Source: Public Records
Map
Nearby Homes
- 522 N Poplar St
- 428 N Poplar St
- 702 Franklin St
- 511 Chestnut St
- 620 N Poplar St
- 452 North Ave
- 325 4th St
- 918 N Ash St
- 723 N County St
- 611 N Genesee St
- 1109 Massena Ave
- 222 Grand Ave
- 917 N Linden Ave
- 509 N Butrick St
- 415 W Ridgeland Ave
- 28 N Saint James St
- 1110 N Ash St
- 824 N Butrick St
- 1122 N Ash St
- 23 N Jackson St