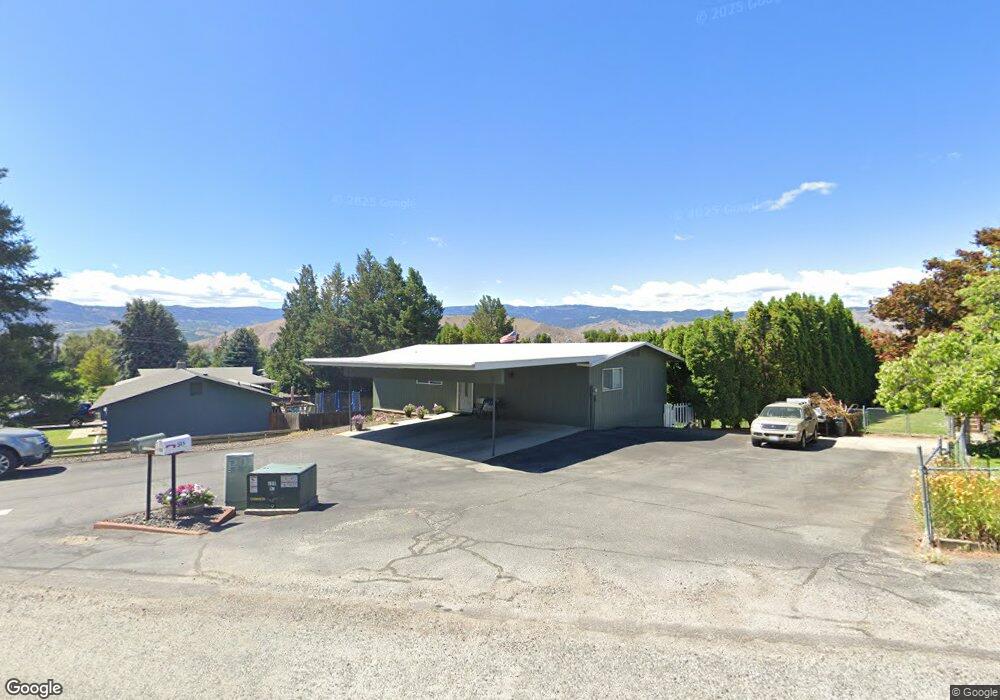
512 N Larch Ave East Wenatchee, WA 98802
Estimated Value: $397,127 - $475,000
3
Beds
1
Bath
1,144
Sq Ft
$380/Sq Ft
Est. Value
About This Home
This home is located at 512 N Larch Ave, East Wenatchee, WA 98802 and is currently estimated at $435,282, approximately $380 per square foot. 512 N Larch Ave is a home located in Douglas County with nearby schools including Kenroy Elementary School, Clovis Point Intermediate School, and Eastmont Junior High School.
Ownership History
Date
Name
Owned For
Owner Type
Purchase Details
Closed on
Jun 28, 2021
Sold by
Dewitt David L
Bought by
Dewitt David L and Dewitt Christine
Current Estimated Value
Home Financials for this Owner
Home Financials are based on the most recent Mortgage that was taken out on this home.
Original Mortgage
$19,405
Outstanding Balance
$17,580
Interest Rate
2.8%
Mortgage Type
FHA
Estimated Equity
$417,702
Purchase Details
Closed on
Apr 12, 2007
Sold by
Warren Karann Dewitt
Bought by
Dewitt David L
Purchase Details
Closed on
Sep 5, 2006
Sold by
Dewitt David and Dewitt Christine
Bought by
Dewitt David and Dewitt Christine
Create a Home Valuation Report for This Property
The Home Valuation Report is an in-depth analysis detailing your home's value as well as a comparison with similar homes in the area
Home Values in the Area
Average Home Value in this Area
Purchase History
| Date | Buyer | Sale Price | Title Company |
|---|---|---|---|
| Dewitt David L | -- | First American Title Ins Co | |
| Dewitt David L | -- | None Available | |
| Dewitt David | -- | None Available |
Source: Public Records
Mortgage History
| Date | Status | Borrower | Loan Amount |
|---|---|---|---|
| Open | Dewitt David L | $19,405 |
Source: Public Records
Tax History Compared to Growth
Tax History
| Year | Tax Paid | Tax Assessment Tax Assessment Total Assessment is a certain percentage of the fair market value that is determined by local assessors to be the total taxable value of land and additions on the property. | Land | Improvement |
|---|---|---|---|---|
| 2025 | $400 | $378,600 | $100,000 | $278,600 |
| 2024 | $3,501 | $363,300 | $100,000 | $263,300 |
| 2023 | $3,721 | $333,300 | $100,000 | $233,300 |
| 2022 | $3,281 | $282,200 | $80,000 | $202,200 |
| 2021 | $3,469 | $282,200 | $80,000 | $202,200 |
| 2020 | $3,367 | $276,500 | $72,000 | $204,500 |
| 2018 | $2,845 | $224,200 | $60,000 | $164,200 |
| 2017 | $2,263 | $224,200 | $60,000 | $164,200 |
| 2016 | $1,986 | $189,600 | $60,000 | $129,600 |
| 2015 | $1,919 | $174,700 | $60,000 | $114,700 |
| 2014 | -- | $161,900 | $60,000 | $101,900 |
| 2013 | -- | $158,900 | $60,000 | $98,900 |
Source: Public Records
Map
Nearby Homes
- 1718 8th St NE
- 561 Morning View Ave
- 800 N Kentucky Ave
- 772 N Keller Ave
- 322 N Kentucky Ave Unit A&B
- 475 N Kansas Ave
- 1810 9th St NE
- 530 Sunday Dr
- 955 N Macaw Ave
- 965 N Macaw Ave
- 902 N Kenroy Terrace
- 565 Sunday Dr
- 531 Nahalee Dr
- 584 Canyon Dr
- 128 N June Ave
- 17 S Lombard Ave
- 1598 Tedford St SE
- 39 Mandolin Ave
- 819 N Newport Loop
- 182 S Keller Ave
- 518 N Larch Ave
- 508 N Larch Ave
- 1825 5th St NE
- 1815 5th St NE
- 1831 5th St NE
- 515 N Lander Ct
- 509 N Lander Ct
- 524 N Larch Ave
- 523 N Lander Ct
- 525 N Larch Ave
- 517 N Larch Ave
- 1805 5th St NE
- 511 N Larch Ave
- 531 N Larch Ave
- 532 N Larch Ave
- 529 N Lander Ct
- 503 N Larch Ave
- 1825 Carl St NE
- 1829 Carl St NE
- 535 N Lander Ct