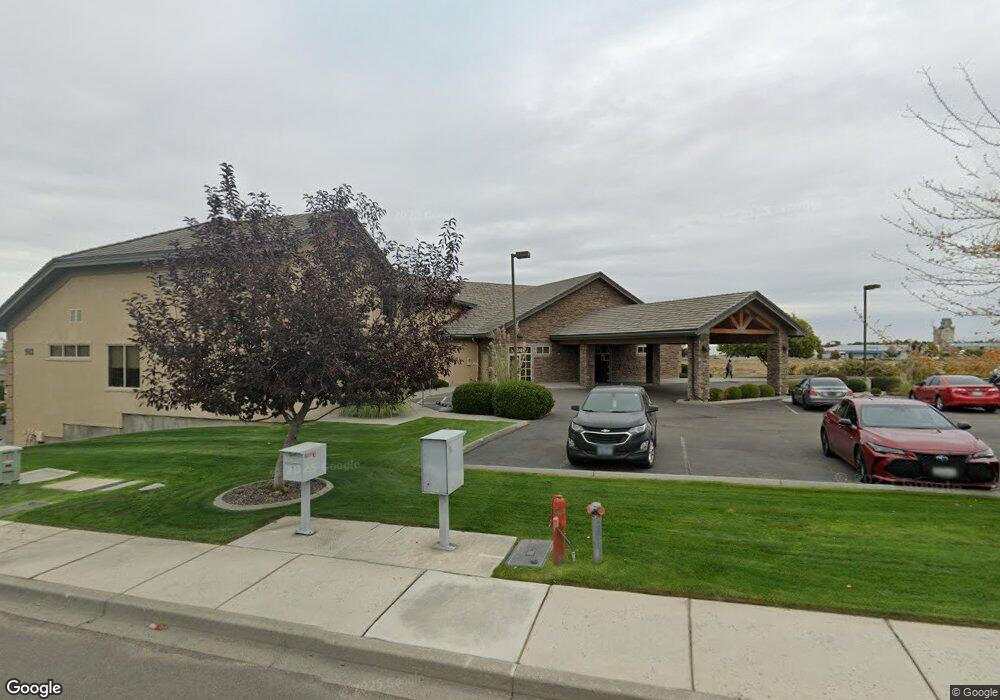
512 N Young St Unit C Kennewick, WA 99336
--
Bed
--
Bath
11,071
Sq Ft
2.31
Acres
About This Home
This home is located at 512 N Young St Unit C, Kennewick, WA 99336. 512 N Young St Unit C is a home located in Benton County with nearby schools including Sunset View Elementary School, Kamiakin High School, and SKYLAR EDUCATION ACADEMY.
Ownership History
Date
Name
Owned For
Owner Type
Purchase Details
Closed on
Jan 4, 2018
Sold by
Marsh Ronald and Marsh Lisa
Bought by
Cboms Buildings Llc
Home Financials for this Owner
Home Financials are based on the most recent Mortgage that was taken out on this home.
Original Mortgage
$942,500
Outstanding Balance
$253,977
Interest Rate
3.92%
Mortgage Type
Purchase Money Mortgage
Purchase Details
Closed on
Jan 3, 2018
Sold by
Cooper Todd C and Cooper Holly S
Bought by
Cboms Building Llc
Home Financials for this Owner
Home Financials are based on the most recent Mortgage that was taken out on this home.
Original Mortgage
$942,500
Outstanding Balance
$253,977
Interest Rate
3.92%
Mortgage Type
Purchase Money Mortgage
Purchase Details
Closed on
Sep 21, 2017
Sold by
Crawford & Marsh Llc
Bought by
Crawford Jonathan and Crawford Cheri
Purchase Details
Closed on
May 13, 2009
Sold by
Marsh Ronald J and Marsh Lisa A
Bought by
Crawford & Marsh Llc
Create a Home Valuation Report for This Property
The Home Valuation Report is an in-depth analysis detailing your home's value as well as a comparison with similar homes in the area
Home Values in the Area
Average Home Value in this Area
Purchase History
| Date | Buyer | Sale Price | Title Company |
|---|---|---|---|
| Cboms Buildings Llc | $125,667 | Cascade Title Co | |
| Cboms Buildings Llc | $125,667 | Cascade Title Co | |
| Cboms Building Llc | $314,165 | Cascade Title Co | |
| Crawford Jonathan | -- | None Available | |
| Crawford & Marsh Llc | -- | None Available |
Source: Public Records
Mortgage History
| Date | Status | Borrower | Loan Amount |
|---|---|---|---|
| Open | Cboms Buildings Llc | $942,500 | |
| Open | Cboms Building Llc | $2,827,500 |
Source: Public Records
Tax History Compared to Growth
Tax History
| Year | Tax Paid | Tax Assessment Tax Assessment Total Assessment is a certain percentage of the fair market value that is determined by local assessors to be the total taxable value of land and additions on the property. | Land | Improvement |
|---|---|---|---|---|
| 2024 | $36,955 | $4,398,340 | $454,810 | $3,943,530 |
| 2023 | $36,955 | $4,686,740 | $414,570 | $4,272,170 |
| 2022 | $37,040 | $3,835,380 | $402,490 | $3,432,890 |
| 2021 | $30,054 | $3,835,380 | $402,490 | $3,432,890 |
| 2020 | $31,438 | $3,015,200 | $402,490 | $2,612,710 |
| 2019 | $30,731 | $3,015,200 | $402,490 | $2,612,710 |
| 2018 | $37,590 | $3,015,200 | $402,490 | $2,612,710 |
| 2017 | $34,759 | $3,015,200 | $402,490 | $2,612,710 |
| 2016 | $35,340 | $3,015,200 | $402,490 | $2,612,710 |
| 2015 | $33,817 | $3,015,200 | $402,490 | $2,612,710 |
| 2014 | -- | $2,863,570 | $402,490 | $2,461,080 |
| 2013 | -- | $2,863,570 | $402,490 | $2,461,080 |
Source: Public Records
Map
Nearby Homes
- 480 N Roosevelt St
- 460 N Roosevelt St
- 312 N Columbia Center Blvd Unit 35
- 311 S Columbia Center Blvd
- 312 S Columbia Center Blvd Unit 95
- 312 S Columbia Center Blvd Unit 45
- 312 S Columbia Center Blvd Unit 93
- 312 S Columbia Center Blvd Unit 85
- 312 S Columbia Center Blvd Unit 23
- 312 S Columbia Center Blvd Unit 71
- 312 S Columbia Center Blvd Unit 86
- 312 S Columbia Center Blvd Unit 89
- 312 S Columbia Center Blvd Unit 74
- 312 S Columbia Center Blvd Unit 96
- 312 S Columbia Center Blvd Unit 63
- 312 S Columbia Center Blvd Unit 28
- 312 S Columbia Center Blvd Unit 51
- 312 S Columbia Center Blvd Unit 62
- 308 S Roosevelt Place
- 7145 W 6th Place
- 512 N Young St
- 7139 W Hood Place
- 7123 W Hood Place
- 533 N Young St
- 7117 W Hood Place
- 601 N Young St
- 601 N Young St Unit B
- 553 N Young St
- 7105 W Hood Place Unit B-201
- 7105 W Hood Place Unit B202
- 7105 W Hood Place Unit B-201
- 7105 W Hood Place
- 7131 W Grandridge Blvd
- 7103 W Grandridge Blvd
- 7103 W Grandridge Blvd Unit A
- 7131 W Deschutes Ave
- 7131 W Deschutes Ave Unit 102
- 7015 W Deschutes Ave
- 7203 W Deschutes Ave
- 7203 W Deschutes Ave