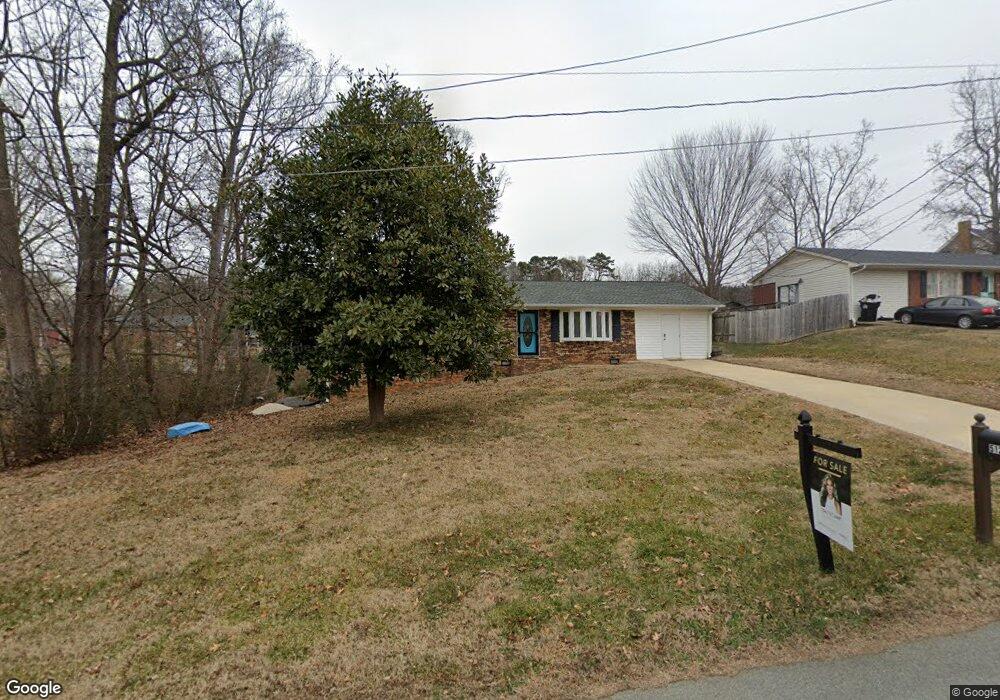
512 Ralphs Blvd Unit 33 Gastonia, NC 28052
Estimated Value: $234,574 - $252,000
3
Beds
2
Baths
1,104
Sq Ft
$221/Sq Ft
Est. Value
About This Home
This home is located at 512 Ralphs Blvd Unit 33, Gastonia, NC 28052 and is currently estimated at $244,394, approximately $221 per square foot. 512 Ralphs Blvd Unit 33 is a home located in Gaston County with nearby schools including Chapel Grove Elementary School, Southwest Middle School, and Hunter Huss High School.
Ownership History
Date
Name
Owned For
Owner Type
Purchase Details
Closed on
Dec 18, 2020
Sold by
Christenbury Eric and Christenbury Christa
Bought by
Brackett Jon M
Current Estimated Value
Home Financials for this Owner
Home Financials are based on the most recent Mortgage that was taken out on this home.
Original Mortgage
$178,002
Outstanding Balance
$158,475
Interest Rate
2.7%
Mortgage Type
VA
Estimated Equity
$85,919
Purchase Details
Closed on
Aug 16, 2019
Sold by
Sherrill Investment Llc
Bought by
Christenbury Eric and Christenbury Christa
Home Financials for this Owner
Home Financials are based on the most recent Mortgage that was taken out on this home.
Original Mortgage
$154,057
Interest Rate
4.12%
Mortgage Type
FHA
Purchase Details
Closed on
Feb 18, 2019
Sold by
U S Bank Na
Bought by
Sherrill Investments Llc
Purchase Details
Closed on
Jan 24, 2019
Sold by
Davenport Lora P
Bought by
U S Bank Na and Cim Trust
Purchase Details
Closed on
Feb 1, 1979
Bought by
Davenport Lora P
Create a Home Valuation Report for This Property
The Home Valuation Report is an in-depth analysis detailing your home's value as well as a comparison with similar homes in the area
Home Values in the Area
Average Home Value in this Area
Purchase History
| Date | Buyer | Sale Price | Title Company |
|---|---|---|---|
| Brackett Jon M | $174,000 | None Available | |
| Christenbury Eric | $157,000 | None Available | |
| Sherrill Investments Llc | $63,000 | None Available | |
| U S Bank Na | $91,926 | None Available | |
| Davenport Lora P | $31,500 | -- |
Source: Public Records
Mortgage History
| Date | Status | Borrower | Loan Amount |
|---|---|---|---|
| Open | Brackett Jon M | $178,002 | |
| Previous Owner | Christenbury Eric | $154,057 |
Source: Public Records
Tax History Compared to Growth
Tax History
| Year | Tax Paid | Tax Assessment Tax Assessment Total Assessment is a certain percentage of the fair market value that is determined by local assessors to be the total taxable value of land and additions on the property. | Land | Improvement |
|---|---|---|---|---|
| 2025 | $1,414 | $197,980 | $20,000 | $177,980 |
| 2024 | $1,414 | $197,980 | $20,000 | $177,980 |
| 2023 | $1,376 | $197,980 | $20,000 | $177,980 |
| 2022 | $1,127 | $122,520 | $15,000 | $107,520 |
| 2021 | $1,131 | $122,520 | $15,000 | $107,520 |
| 2020 | $1,131 | $122,520 | $15,000 | $107,520 |
| 2019 | $1,032 | $110,620 | $15,000 | $95,620 |
| 2018 | $782 | $80,200 | $12,000 | $68,200 |
| 2017 | $724 | $74,301 | $12,000 | $62,301 |
| 2016 | $724 | $74,301 | $0 | $0 |
| 2014 | $742 | $76,850 | $15,000 | $61,850 |
Source: Public Records
Map
Nearby Homes
- 5309 Lewis Rd
- 624 Ralphs Blvd
- 5028 Lewis Rd
- 106 Pecan Grove Cir Unit 11
- 308 Polo Dr Unit 22
- 516 Basswood Way
- 4606 Cloverwood Ln
- 4609 Cottonwood Ln
- 129 Hunter Lee Ln
- 4618 Cottonwood Ln
- 4642 King Crowder Dr
- 4841 Greenwood Dr
- 4814 Chapel Grove Rd
- 4901 Chapel Grove Rd
- 0 Falls Ferguson Rd Unit 30
- 4636 Merrywood Ln
- 416 Donna Ave
- 618 Camp Rotary Rd
- 1014 Spring Dr
- 1040 Spring Dr
- 512 Ralphs Blvd
- 508 Ralphs Blvd
- 3707 Branding Iron Dr
- 3711 Branding Iron Dr
- 520 Ralphs Blvd
- 5256 Lewis Rd
- 513 Ralphs Blvd
- 3715 Branding Iron Dr
- 509 Ralphs Blvd
- 3703 Branding Iron Dr
- 517 Ralphs Blvd
- 505 Ralphs Blvd
- 524 Ralphs Blvd
- 3719 Branding Iron Dr
- 501 Ralphs Blvd
- 00 Boyd Rd
- 523 Ralphs Blvd
- 3710 Branding Iron Dr
- 3706 Branding Iron Dr
- 2726 Joy St