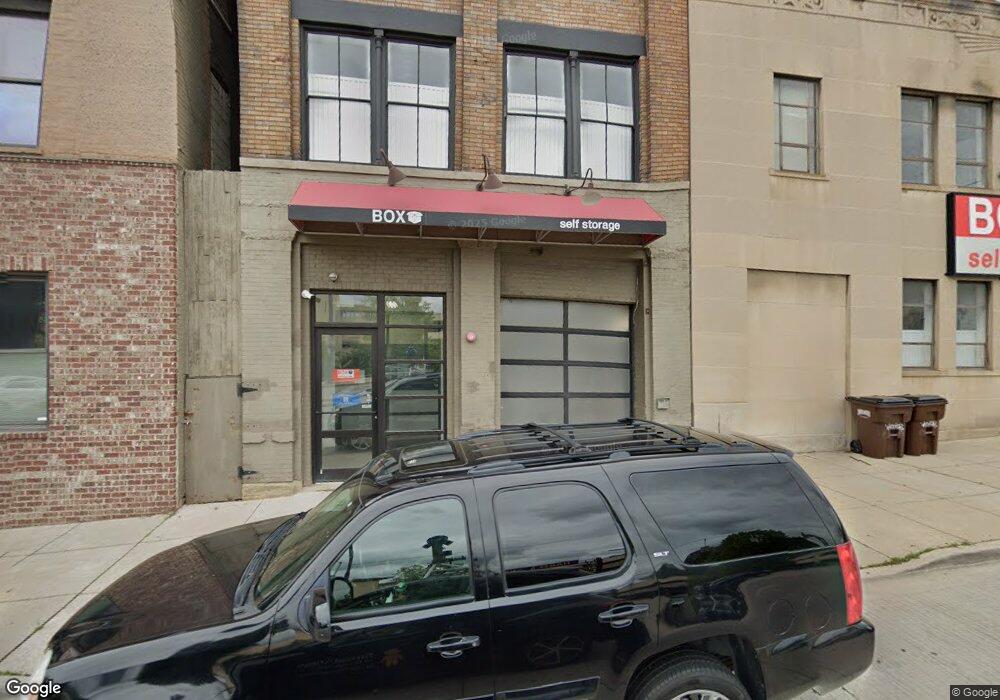
512 Reading Rd Unit 201 Cincinnati, OH 45202
Pendleton NeighborhoodEstimated Value: $392,160 - $651,000
2
Beds
2
Baths
1,527
Sq Ft
$317/Sq Ft
Est. Value
About This Home
This home is located at 512 Reading Rd Unit 201, Cincinnati, OH 45202 and is currently estimated at $484,040, approximately $316 per square foot. 512 Reading Rd Unit 201 is a home located in Hamilton County with nearby schools including Rothenberg Preparatory Academy, Robert A. Taft Information Technology High School, and Clark Montessori High School.
Ownership History
Date
Name
Owned For
Owner Type
Purchase Details
Closed on
Jul 1, 2011
Sold by
Fat City Properties Llc
Bought by
Hebenstreit Bret A and Garcia Maria R
Current Estimated Value
Home Financials for this Owner
Home Financials are based on the most recent Mortgage that was taken out on this home.
Original Mortgage
$272,612
Outstanding Balance
$184,732
Interest Rate
4.5%
Mortgage Type
FHA
Estimated Equity
$299,308
Create a Home Valuation Report for This Property
The Home Valuation Report is an in-depth analysis detailing your home's value as well as a comparison with similar homes in the area
Home Values in the Area
Average Home Value in this Area
Purchase History
| Date | Buyer | Sale Price | Title Company |
|---|---|---|---|
| Hebenstreit Bret A | $282,500 | Attorney |
Source: Public Records
Mortgage History
| Date | Status | Borrower | Loan Amount |
|---|---|---|---|
| Open | Hebenstreit Bret A | $272,612 |
Source: Public Records
Tax History
| Year | Tax Paid | Tax Assessment Tax Assessment Total Assessment is a certain percentage of the fair market value that is determined by local assessors to be the total taxable value of land and additions on the property. | Land | Improvement |
|---|---|---|---|---|
| 2025 | $7,231 | $117,541 | $17,500 | $100,041 |
| 2023 | $7,171 | $117,541 | $17,500 | $100,041 |
| 2022 | $7,338 | $107,912 | $17,500 | $90,412 |
| 2021 | $7,068 | $107,912 | $17,500 | $90,412 |
| 2020 | $2,075 | $107,912 | $17,500 | $90,412 |
| 2019 | $2,249 | $107,912 | $17,500 | $90,412 |
| 2018 | $2,247 | $107,912 | $17,500 | $90,412 |
| 2017 | $2,135 | $107,912 | $17,500 | $90,412 |
| 2016 | $1,764 | $110,250 | $10,150 | $100,100 |
| 2015 | $1,589 | $110,250 | $10,150 | $100,100 |
| 2014 | $1,601 | $110,250 | $10,150 | $100,100 |
| 2013 | $1,519 | $98,875 | $10,150 | $88,725 |
Source: Public Records
Map
Nearby Homes
- 512 Reading Rd
- 512 Reading Rd
- 512 Reading Rd
- 512 Reading Rd
- 512 Reading Rd
- 512 Reading Rd
- 512 Reading Rd
- 512 Reading Rd
- 512 Reading Rd
- 512 Reading Rd
- 512 Reading Rd Unit 204
- 512 Reading Rd Unit 203
- 512 Reading Rd Unit 101
- 512 Reading Rd Unit 302
- 512 Reading Rd Unit 301
- 512 Reading Rd Unit 402
- 512 Reading Rd Unit 403
- 512 Reading Rd Unit 102
- 512 Reading Rd Unit 401
- 512 Reading Rd Unit 202
Your Personal Tour Guide
Ask me questions while you tour the home.