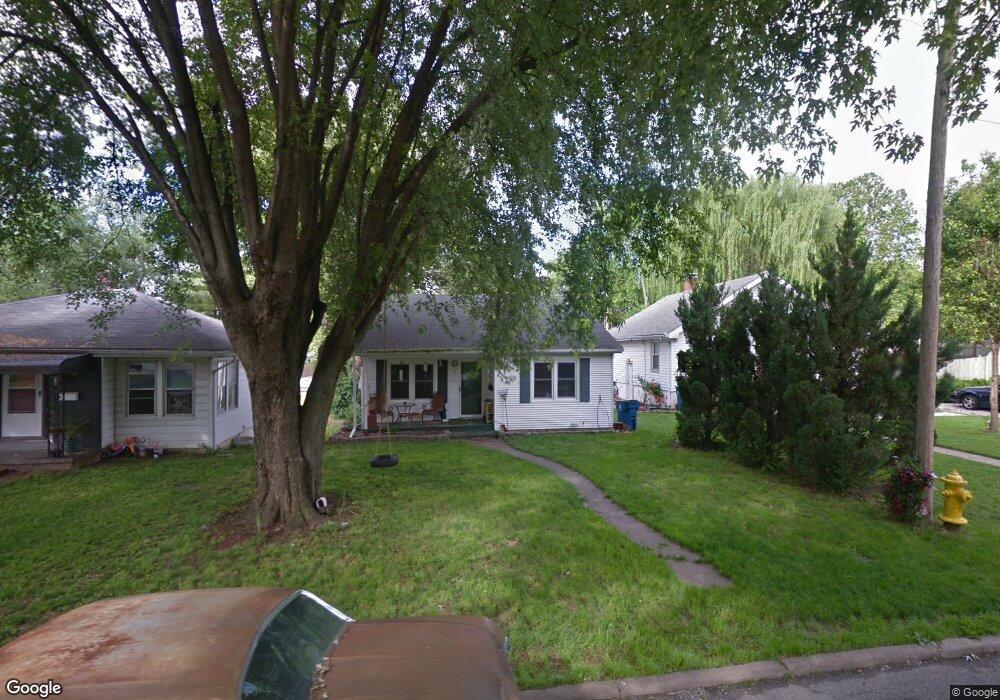
512 Rebecca Ave Collinsville, IL 62234
Estimated Value: $125,958 - $185,000
3
Beds
1
Bath
926
Sq Ft
$155/Sq Ft
Est. Value
About This Home
This home is located at 512 Rebecca Ave, Collinsville, IL 62234 and is currently estimated at $143,740, approximately $155 per square foot. 512 Rebecca Ave is a home located in Madison County with nearby schools including John A Renfro Elementary School, Dorris Intermediate School, and Collinsville Middle School.
Ownership History
Date
Name
Owned For
Owner Type
Purchase Details
Closed on
May 2, 2022
Sold by
Dominick Rodney J
Bought by
Dominick Eva
Current Estimated Value
Home Financials for this Owner
Home Financials are based on the most recent Mortgage that was taken out on this home.
Original Mortgage
$102,500
Outstanding Balance
$98,095
Interest Rate
6.13%
Mortgage Type
New Conventional
Estimated Equity
$45,645
Purchase Details
Closed on
May 8, 2009
Sold by
Dominick Rodney J and Dominick Randen L
Bought by
Dominick Rodney J and Dominick Eva
Home Financials for this Owner
Home Financials are based on the most recent Mortgage that was taken out on this home.
Original Mortgage
$105,362
Interest Rate
4.9%
Mortgage Type
FHA
Purchase Details
Closed on
Jul 14, 2006
Sold by
Rydgig Paul V
Bought by
Dominick Rodney J and Dominick Randen L
Home Financials for this Owner
Home Financials are based on the most recent Mortgage that was taken out on this home.
Original Mortgage
$100,105
Interest Rate
6.73%
Mortgage Type
FHA
Create a Home Valuation Report for This Property
The Home Valuation Report is an in-depth analysis detailing your home's value as well as a comparison with similar homes in the area
Home Values in the Area
Average Home Value in this Area
Purchase History
| Date | Buyer | Sale Price | Title Company |
|---|---|---|---|
| Dominick Eva | -- | Abstracts & Titles | |
| Dominick Rodney J | -- | Benchmark Title Company | |
| Dominick Rodney J | $101,000 | Abstracts & Titles Inc |
Source: Public Records
Mortgage History
| Date | Status | Borrower | Loan Amount |
|---|---|---|---|
| Open | Dominick Eva | $102,500 | |
| Previous Owner | Dominick Rodney J | $105,362 | |
| Previous Owner | Dominick Rodney J | $100,105 |
Source: Public Records
Tax History Compared to Growth
Tax History
| Year | Tax Paid | Tax Assessment Tax Assessment Total Assessment is a certain percentage of the fair market value that is determined by local assessors to be the total taxable value of land and additions on the property. | Land | Improvement |
|---|---|---|---|---|
| 2024 | $2,039 | $37,890 | $7,200 | $30,690 |
| 2023 | $2,039 | $35,070 | $6,660 | $28,410 |
| 2022 | $1,913 | $31,520 | $5,960 | $25,560 |
| 2021 | $1,631 | $29,610 | $5,600 | $24,010 |
| 2020 | $1,553 | $28,250 | $5,340 | $22,910 |
| 2019 | $1,498 | $27,290 | $5,160 | $22,130 |
| 2018 | $1,238 | $22,910 | $4,870 | $18,040 |
| 2017 | $1,230 | $22,450 | $4,770 | $17,680 |
| 2016 | $1,286 | $22,450 | $4,770 | $17,680 |
| 2015 | $1,188 | $21,870 | $4,650 | $17,220 |
| 2014 | $1,188 | $21,870 | $4,650 | $17,220 |
| 2013 | $1,188 | $21,870 | $4,650 | $17,220 |
Source: Public Records
Map
Nearby Homes
- 1210 Constance St
- 1120 Williams St
- 308 Brown Ave
- 501 Spring
- 617 N Morrison Ave
- 1224 Cedar Ridge Ct
- 919 Vine St
- 203 Greenfield Dr
- 921 Prospect St
- 123 W Wickliffe Ave
- 1227 Ridge Ave
- 706 Illinois Ave
- 0 N Keebler Ave
- 0 Strong Ave
- 238 Mill St
- 123 Elliot St
- 414 Bunker Hill Dr
- 892 Lester Ave
- 404 E Church St
- 22 Brookwood Dr
- 514 Rebecca Ave
- 510 Rebecca Ave
- 506 Rebecca Ave
- 519 Wadsworth St
- 511 Wadsworth St
- 919 Vandalia St
- 507 Wadsworth St
- 502 Rebecca Ave
- 511 Rebecca Ave
- 513 Rebecca Ave
- 505 Wadsworth St
- 907 Vandalia St
- 515 Rebecca Ave
- 507 Rebecca Ave
- 501 Wadsworth St
- 905 Vandalia St
- 1003 Vandalia St
- 1200 Constance St
- 1123 Constance St
- 1005 Vandalia St