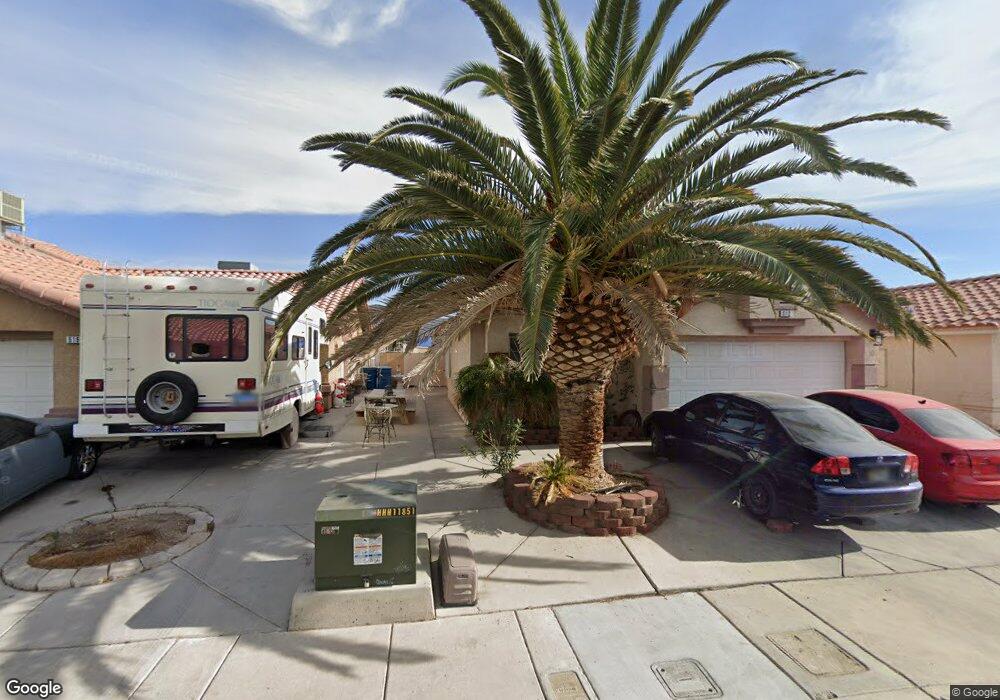
512 Red Bandana St Las Vegas, NV 89110
East Las Vegas NeighborhoodEstimated Value: $351,756 - $385,000
3
Beds
2
Baths
1,286
Sq Ft
$287/Sq Ft
Est. Value
About This Home
This home is located at 512 Red Bandana St, Las Vegas, NV 89110 and is currently estimated at $369,689, approximately $287 per square foot. 512 Red Bandana St is a home located in Clark County with nearby schools including Oran K Gragson Elementary School, Roy West Martin Middle School, and Desert Pines High School.
Ownership History
Date
Name
Owned For
Owner Type
Purchase Details
Closed on
Mar 30, 2003
Sold by
Hernandez Jose L and Hernandez Maria
Bought by
Soto Roque
Current Estimated Value
Home Financials for this Owner
Home Financials are based on the most recent Mortgage that was taken out on this home.
Original Mortgage
$136,507
Outstanding Balance
$58,513
Interest Rate
5.72%
Mortgage Type
FHA
Estimated Equity
$311,176
Purchase Details
Closed on
Dec 22, 1998
Sold by
Hernandez Tomas A
Bought by
Hernandez Jose L and Hernandez Maria
Home Financials for this Owner
Home Financials are based on the most recent Mortgage that was taken out on this home.
Original Mortgage
$97,600
Interest Rate
6.91%
Purchase Details
Closed on
Mar 25, 1996
Sold by
River Rock Homes Ltd Partnership
Bought by
Hernandez Jose L and Hernandez Maria
Home Financials for this Owner
Home Financials are based on the most recent Mortgage that was taken out on this home.
Original Mortgage
$95,950
Interest Rate
6.98%
Create a Home Valuation Report for This Property
The Home Valuation Report is an in-depth analysis detailing your home's value as well as a comparison with similar homes in the area
Home Values in the Area
Average Home Value in this Area
Purchase History
| Date | Buyer | Sale Price | Title Company |
|---|---|---|---|
| Soto Roque | $139,000 | United Title Of Nevada | |
| Hernandez Jose L | -- | Fidelity National Title | |
| Hernandez Jose L | $99,000 | Stewart Title |
Source: Public Records
Mortgage History
| Date | Status | Borrower | Loan Amount |
|---|---|---|---|
| Open | Soto Roque | $136,507 | |
| Previous Owner | Hernandez Jose L | $97,600 | |
| Previous Owner | Hernandez Jose L | $95,950 |
Source: Public Records
Tax History Compared to Growth
Tax History
| Year | Tax Paid | Tax Assessment Tax Assessment Total Assessment is a certain percentage of the fair market value that is determined by local assessors to be the total taxable value of land and additions on the property. | Land | Improvement |
|---|---|---|---|---|
| 2025 | $914 | $66,246 | $21,700 | $44,546 |
| 2024 | $888 | $66,246 | $21,700 | $44,546 |
| 2023 | $716 | $67,813 | $25,550 | $42,263 |
| 2022 | $862 | $59,085 | $20,300 | $38,785 |
| 2021 | $837 | $55,783 | $18,900 | $36,883 |
| 2020 | $810 | $54,224 | $17,500 | $36,724 |
| 2019 | $800 | $50,685 | $14,350 | $36,335 |
| 2018 | $764 | $46,843 | $11,900 | $34,943 |
| 2017 | $1,504 | $45,886 | $10,500 | $35,386 |
| 2016 | $716 | $36,936 | $7,000 | $29,936 |
| 2015 | $713 | $34,880 | $5,600 | $29,280 |
| 2014 | $693 | $20,495 | $3,850 | $16,645 |
Source: Public Records
Map
Nearby Homes
- 4117 Lighthouse Ave
- 4028 Lighthouse Ave
- 4108 Montebello Ave
- 4100 Montebello Ave
- 348 Century Dr
- 461 N Lamb Blvd Unit H
- 453 N Lamb Blvd Unit F
- 3933 Lighthouse Ave
- 445 N Lamb Blvd Unit C
- 425 N Lamb Blvd Unit D
- 3908 Montebello Ave
- 413 N Lamb Blvd Unit F
- 1405 N Sandhill Rd Unit 2
- 275 N Lamb Blvd Unit A
- 432 Anchor St
- 4224 Estaban Ct
- 653 Lineshack Ln
- 408 Rhoda St
- 745 Taft Ct
- 3982 Saguaro Ln
- 508 Red Bandana St
- 516 Red Bandana St
- 504 Red Bandana St
- 520 Red Bandana St
- 500 Red Bandana St
- 524 Red Bandana St
- 4132 Lighthouse Ave
- 4133 Buffalo Bill Ave
- 4128 Lighthouse Ave
- 4141 Lighthouse Ave
- 4144 Buffalo Bill Ave
- 4140 Buffalo Bill Ave
- 4137 Lighthouse Ave
- 4129 Buffalo Bill Ave
- 4124 Lighthouse Ave
- 4136 Buffalo Bill Ave
- 4133 Lighthouse Ave
- 4125 Buffalo Bill Ave
- 4132 Buffalo Bill Ave
- 4129 Lighthouse Ave