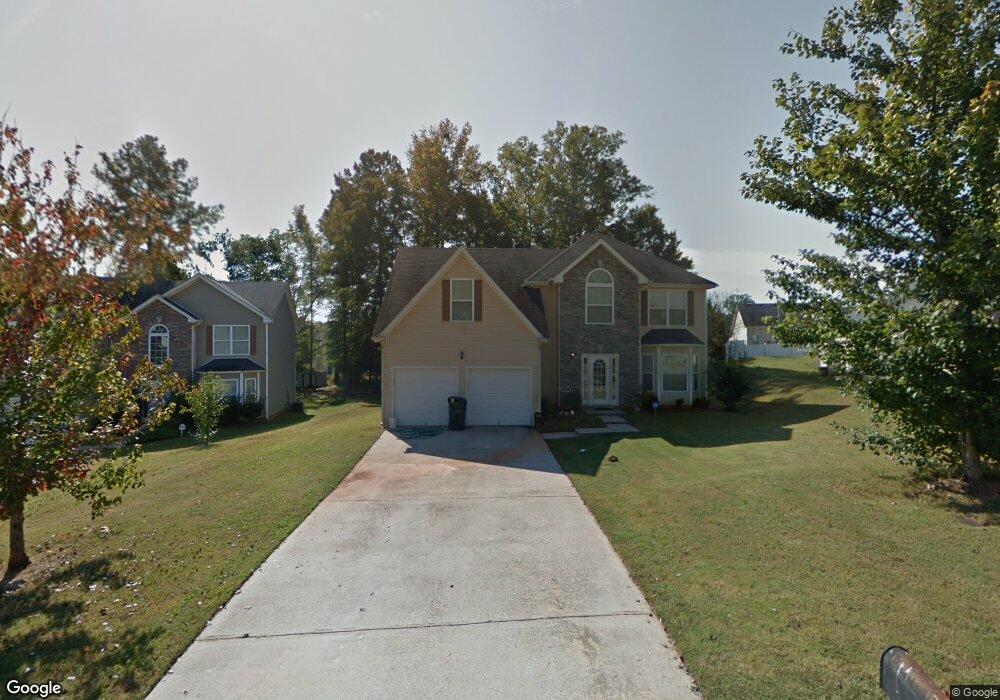
512 Rosalind Terrace Locust Grove, GA 30248
Estimated Value: $321,648 - $379,000
4
Beds
3
Baths
2,876
Sq Ft
$121/Sq Ft
Est. Value
About This Home
This home is located at 512 Rosalind Terrace, Locust Grove, GA 30248 and is currently estimated at $347,912, approximately $120 per square foot. 512 Rosalind Terrace is a home located in Henry County with nearby schools including Unity Grove Elementary School, Locust Grove Middle School, and Locust Grove High School.
Ownership History
Date
Name
Owned For
Owner Type
Purchase Details
Closed on
Jun 9, 2017
Sold by
Threadcraft Cheryl
Bought by
Cruz Ernesto
Current Estimated Value
Purchase Details
Closed on
Oct 24, 2008
Sold by
Hud-Housing Of Urban Dev
Bought by
Threadcraft Cheryl L
Home Financials for this Owner
Home Financials are based on the most recent Mortgage that was taken out on this home.
Original Mortgage
$129,438
Interest Rate
5.96%
Mortgage Type
FHA
Purchase Details
Closed on
Apr 19, 2008
Sold by
Clonts Benjamin R
Bought by
Hud-Housing Of Urban Dev
Purchase Details
Closed on
Nov 22, 2005
Sold by
Homelife Cmntys Henry Inc
Bought by
Clonts Benjamin R and Clonts Deeana L
Home Financials for this Owner
Home Financials are based on the most recent Mortgage that was taken out on this home.
Original Mortgage
$183,968
Interest Rate
6.1%
Mortgage Type
FHA
Create a Home Valuation Report for This Property
The Home Valuation Report is an in-depth analysis detailing your home's value as well as a comparison with similar homes in the area
Home Values in the Area
Average Home Value in this Area
Purchase History
| Date | Buyer | Sale Price | Title Company |
|---|---|---|---|
| Cruz Ernesto | $160,000 | -- | |
| Threadcraft Cheryl L | -- | -- | |
| Hud-Housing Of Urban Dev | -- | -- | |
| Clonts Benjamin R | $185,500 | -- |
Source: Public Records
Mortgage History
| Date | Status | Borrower | Loan Amount |
|---|---|---|---|
| Previous Owner | Threadcraft Cheryl L | $129,438 | |
| Previous Owner | Clonts Benjamin R | $183,968 |
Source: Public Records
Tax History Compared to Growth
Tax History
| Year | Tax Paid | Tax Assessment Tax Assessment Total Assessment is a certain percentage of the fair market value that is determined by local assessors to be the total taxable value of land and additions on the property. | Land | Improvement |
|---|---|---|---|---|
| 2025 | $5,260 | $135,200 | $14,000 | $121,200 |
| 2024 | $5,260 | $134,600 | $14,000 | $120,600 |
| 2023 | $4,634 | $128,000 | $14,000 | $114,000 |
| 2022 | $3,850 | $105,480 | $14,000 | $91,480 |
| 2021 | $3,042 | $82,960 | $14,000 | $68,960 |
| 2020 | $2,726 | $74,240 | $10,000 | $64,240 |
| 2019 | $2,476 | $66,240 | $10,000 | $56,240 |
| 2018 | $0 | $63,600 | $10,000 | $53,600 |
| 2016 | $1,780 | $54,440 | $8,000 | $46,440 |
| 2015 | $1,853 | $55,000 | $8,000 | $47,000 |
| 2014 | $1,666 | $49,960 | $8,000 | $41,960 |
Source: Public Records
Map
Nearby Homes
- 419 Grier Dr
- 407 Grier Dr
- 551 Rosalind Terrace
- 165 Leguin Mill Rd
- 312 Peeksville Rd
- 117 Elkins Blvd
- 0 Peeksville Rd Unit 20131057
- 0 Courtney Ct Unit 10432404
- 155 Club Dr
- 544 Harmony Way
- 107 Club Dr
- 300 Leguin Mill Rd
- 648 Kimberwick Dr
- 708 Curb Ct
- 217 Paisley Way
- 149 Elkins Blvd
- 328 Trulove Ln Unit 32
- 316 Trulove Ln Unit 35
- Roswell Plan at Peeksville Landing
- Oakland Plan at Peeksville Landing
- 508 Rosalind Terrace
- 516 Rosalind Terrace
- 520 Rosalind Terrace
- 504 Rosalind Terrace
- 140 Laughlin Dr
- 144 Laughlin Dr
- 513 Rosalind Terrace
- 138 Laughlin Dr
- 138 Laughlin Dr
- 138 Laughlin Dr Unit 63
- 146 Laughlin Dr
- 524 Rosalind Terrace
- 0 Laughlin Dr Unit 8645339
- 0 Laughlin Dr Unit 8915594
- 0 Laughlin Dr Unit 7544789
- 0 Laughlin Dr Unit 3284529
- 0 Laughlin Dr Unit 7004151
- 0 Laughlin Dr Unit 8735067
- 0 Laughlin Dr Unit 3206691
- 0 Laughlin Dr Unit 3262086