512 S 800 E Salt Lake City, UT 84102
East Central NeighborhoodEstimated Value: $554,000 - $665,000
3
Beds
2
Baths
1,974
Sq Ft
$314/Sq Ft
Est. Value
About This Home
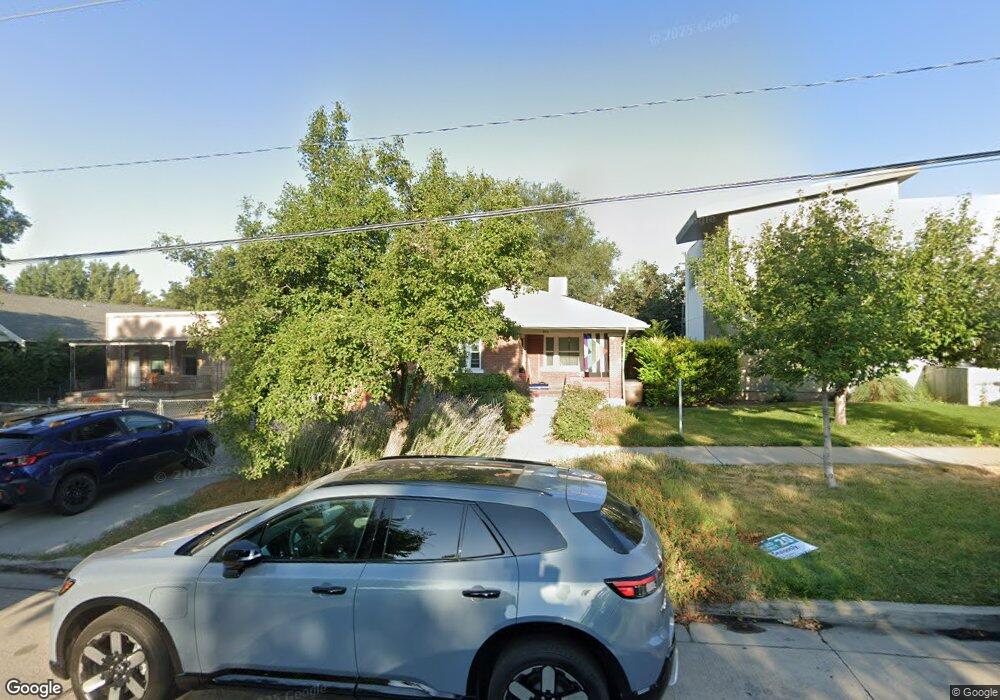
This home is located at 512 S 800 E, Salt Lake City, UT 84102 and is currently estimated at $620,026, approximately $314 per square foot. 512 S 800 E is a home located in Salt Lake County with nearby schools including Bennion Elementary School, Wasatch Elementary School, and East High School.
Ownership History
Date
Name
Owned For
Owner Type
Purchase Details
Closed on
Jun 11, 2009
Sold by
Fleischman D Rebecca
Bought by
Johnson Charles M and Johnson Erin P
Current Estimated Value
Purchase Details
Closed on
Nov 30, 1993
Sold by
Bassett Helen K and Keller Barbara K
Bought by
Fleischman D Rebecca
Home Financials for this Owner
Home Financials are based on the most recent Mortgage that was taken out on this home.
Original Mortgage
$54,800
Interest Rate
6.74%
Create a Home Valuation Report for This Property
The Home Valuation Report is an in-depth analysis detailing your home's value as well as a comparison with similar homes in the area
Home Values in the Area
Average Home Value in this Area
Purchase History
| Date | Buyer | Sale Price | Title Company |
|---|---|---|---|
| Johnson Charles M | -- | First American Title | |
| Fleischman D Rebecca | -- | Founders Title |
Source: Public Records
Mortgage History
| Date | Status | Borrower | Loan Amount |
|---|---|---|---|
| Previous Owner | Fleischman D Rebecca | $54,800 |
Source: Public Records
Tax History Compared to Growth
Tax History
| Year | Tax Paid | Tax Assessment Tax Assessment Total Assessment is a certain percentage of the fair market value that is determined by local assessors to be the total taxable value of land and additions on the property. | Land | Improvement |
|---|---|---|---|---|
| 2025 | $2,736 | $560,300 | $153,100 | $407,200 |
| 2024 | $2,736 | $522,000 | $144,900 | $377,100 |
| 2023 | $2,757 | $507,000 | $153,100 | $353,900 |
| 2022 | $2,986 | $515,300 | $150,100 | $365,200 |
| 2021 | $2,602 | $406,500 | $116,700 | $289,800 |
| 2020 | $1,905 | $283,300 | $106,700 | $176,600 |
| 2019 | $1,906 | $266,600 | $100,100 | $166,500 |
| 2018 | $1,892 | $257,800 | $100,100 | $157,700 |
| 2017 | $2,056 | $262,400 | $100,100 | $162,300 |
| 2016 | $1,960 | $237,500 | $57,500 | $180,000 |
| 2015 | $1,716 | $197,200 | $56,300 | $140,900 |
| 2014 | $1,645 | $187,500 | $55,200 | $132,300 |
Source: Public Records
Map
Nearby Homes
- 827 E 500 S
- 504 S 900 E
- 606 S 900 E
- 543 S 900 E Unit A11
- 531 S 900 E Unit B3
- 717 S 800 E
- 915 E 600 S
- 624 S 600 E
- 525 S 900 E Unit B2
- 532 E 600 S
- 537 S 500 E Unit 105
- 426 S 1000 E Unit 600
- 426 S 1000 E Unit 707
- 714 S 600 E
- 745 S 600 E
- 515 S 1000 E Unit 706
- 515 S 1000 E Unit 406
- 515 S 1000 E Unit 1104
- 515 S 1000 E Unit 504
- 804 S 700 E Unit 6