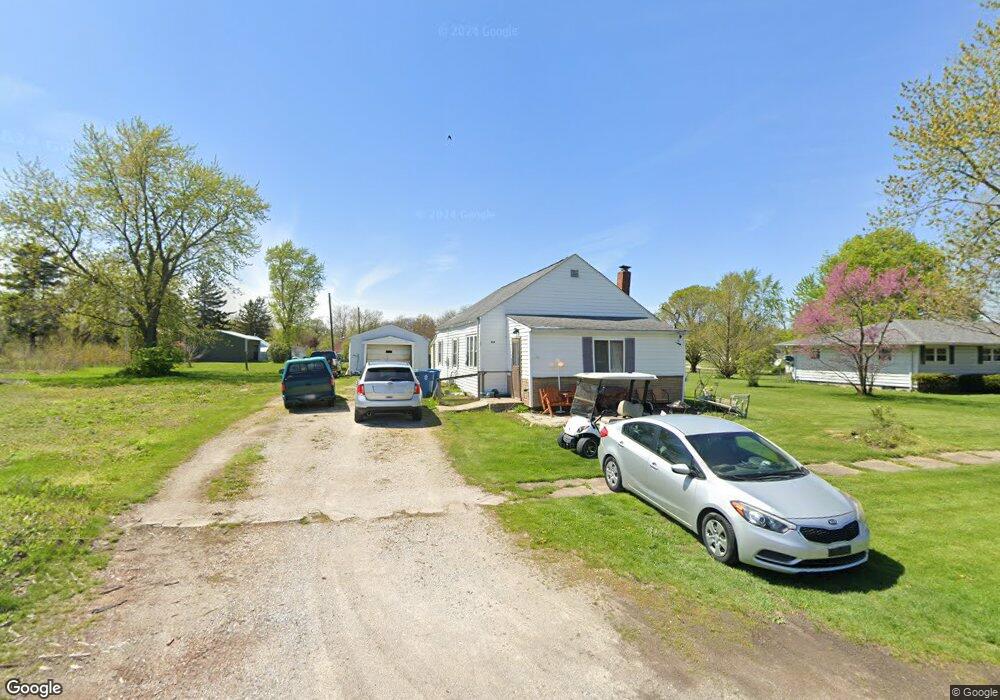
512 S Benton St Goodland, IN 47948
Estimated Value: $103,000 - $152,000
3
Beds
1
Bath
1,008
Sq Ft
$116/Sq Ft
Est. Value
About This Home
This home is located at 512 S Benton St, Goodland, IN 47948 and is currently estimated at $116,987, approximately $116 per square foot. 512 S Benton St is a home located in Newton County with nearby schools including South Newton Elementary School, South Newton Middle School, and South Newton Senior High School.
Ownership History
Date
Name
Owned For
Owner Type
Purchase Details
Closed on
Jul 1, 2018
Sold by
Harbour Portfolio 7
Bought by
Headlands Asset Mgmt
Current Estimated Value
Purchase Details
Closed on
Mar 29, 2018
Sold by
Harbour Lp
Bought by
Headlands Lp
Purchase Details
Closed on
Oct 18, 2011
Sold by
Fannie Mae
Bought by
Harbour Portfolio Vii Lp
Purchase Details
Closed on
May 20, 2011
Sold by
Martin John M and Martin Renee M
Bought by
Federal National Mortgage Association
Create a Home Valuation Report for This Property
The Home Valuation Report is an in-depth analysis detailing your home's value as well as a comparison with similar homes in the area
Home Values in the Area
Average Home Value in this Area
Purchase History
| Date | Buyer | Sale Price | Title Company |
|---|---|---|---|
| Headlands Asset Mgmt | -- | -- | |
| Headlands Lp | $16,300 | -- | |
| Harbour Portfolio Vii Lp | $6,325 | -- | |
| Federal National Mortgage Association | -- | -- |
Source: Public Records
Tax History Compared to Growth
Tax History
| Year | Tax Paid | Tax Assessment Tax Assessment Total Assessment is a certain percentage of the fair market value that is determined by local assessors to be the total taxable value of land and additions on the property. | Land | Improvement |
|---|---|---|---|---|
| 2024 | $1,362 | $68,100 | $13,000 | $55,100 |
| 2023 | $1,270 | $63,500 | $13,000 | $50,500 |
| 2022 | $1,260 | $63,000 | $13,000 | $50,000 |
| 2021 | $1,248 | $62,400 | $10,800 | $51,600 |
| 2020 | $1,263 | $62,400 | $10,800 | $51,600 |
| 2019 | $1,143 | $56,400 | $10,800 | $45,600 |
| 2018 | $1,149 | $56,700 | $10,800 | $45,900 |
| 2017 | $866 | $42,400 | $7,800 | $34,600 |
| 2016 | $793 | $38,700 | $7,800 | $30,900 |
| 2014 | $685 | $34,100 | $7,800 | $26,300 |
| 2013 | $685 | $32,700 | $7,800 | $24,900 |
Source: Public Records
Map
Nearby Homes
- 516 S Benton St
- 508 S Benton St
- 217 E Mill St
- 213 E Mill St
- 507 S Benton St
- 522 S Benton St
- 503 S Benton St
- 523 S James St
- 519 S James St
- 528 S Benton St
- 533 S James St
- 532 S Benton St
- 516 S James St
- 510 S James St
- 520 S James St
- 417 S Benton St
- 222 E North St
- 528 S James St
- 206 E North St
- 532 S James St