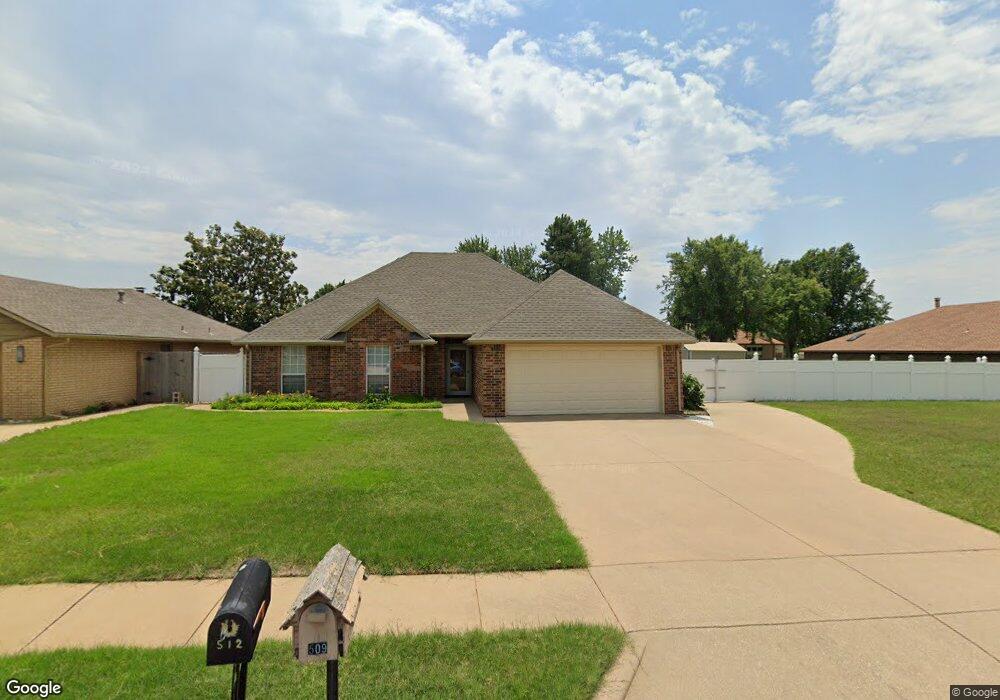
512 Shannon Rd Ponca City, OK 74601
Estimated Value: $196,000 - $229,000
3
Beds
2
Baths
1,511
Sq Ft
$138/Sq Ft
Est. Value
About This Home
This home is located at 512 Shannon Rd, Ponca City, OK 74601 and is currently estimated at $208,986, approximately $138 per square foot. 512 Shannon Rd is a home located in Kay County with nearby schools including Union Elementary School, Ponca City East Middle School, and Ponca City West Middle School.
Ownership History
Date
Name
Owned For
Owner Type
Purchase Details
Closed on
Nov 13, 2019
Sold by
Carson Derell and Carson Barbara J
Bought by
Mcdonald William J
Current Estimated Value
Home Financials for this Owner
Home Financials are based on the most recent Mortgage that was taken out on this home.
Original Mortgage
$134,000
Outstanding Balance
$117,649
Interest Rate
3.5%
Mortgage Type
New Conventional
Estimated Equity
$91,337
Purchase Details
Closed on
Oct 26, 2011
Sold by
Mcguffin James E
Bought by
Carson Derell and Carson Barbara
Purchase Details
Closed on
Jun 23, 2006
Sold by
Richman Lance T and Richman Marilyn L
Bought by
Mcguffin James E
Purchase Details
Closed on
Aug 31, 1998
Sold by
Francis Donnelly
Bought by
Marilyn Lance and Marilyn Richman
Purchase Details
Closed on
Nov 19, 1991
Sold by
Don Bouldin Inc
Bought by
Francis M Donnelly
Create a Home Valuation Report for This Property
The Home Valuation Report is an in-depth analysis detailing your home's value as well as a comparison with similar homes in the area
Home Values in the Area
Average Home Value in this Area
Purchase History
| Date | Buyer | Sale Price | Title Company |
|---|---|---|---|
| Mcdonald William J | $167,500 | Security Title Services | |
| Carson Derell | $133,000 | -- | |
| Mcguffin James E | $141,000 | -- | |
| Marilyn Lance | $106,000 | -- | |
| Francis M Donnelly | $96,000 | -- |
Source: Public Records
Mortgage History
| Date | Status | Borrower | Loan Amount |
|---|---|---|---|
| Open | Mcdonald William J | $134,000 |
Source: Public Records
Tax History Compared to Growth
Tax History
| Year | Tax Paid | Tax Assessment Tax Assessment Total Assessment is a certain percentage of the fair market value that is determined by local assessors to be the total taxable value of land and additions on the property. | Land | Improvement |
|---|---|---|---|---|
| 2024 | $1,923 | $20,314 | $1,782 | $18,532 |
| 2023 | $1,923 | $19,346 | $1,782 | $17,564 |
| 2022 | $1,753 | $18,426 | $2,228 | $16,198 |
| 2021 | $1,762 | $18,426 | $2,228 | $16,198 |
| 2020 | $1,744 | $18,426 | $2,228 | $16,198 |
| 2019 | $1,302 | $14,626 | $1,782 | $12,844 |
| 2018 | $1,324 | $14,678 | $1,782 | $12,896 |
| 2017 | $1,357 | $14,848 | $1,782 | $13,066 |
| 2016 | $1,388 | $15,017 | $1,782 | $13,235 |
| 2015 | $1,377 | $14,847 | $1,782 | $13,065 |
| 2014 | $1,342 | $14,750 | $1,782 | $12,968 |
Source: Public Records
Map
Nearby Homes
- TBD 5th and Windsor
- 1009 Brentwood Dr
- 120 E Woodbury Rd
- 3651 N 14th St
- 2000 N 5th St
- 2005 N 4th St
- 0000 N Union St
- 3019 Meadow Ln
- 1704 Fairway Place
- 3013 Kingston Rd
- 1703 Leslie Ln
- 1128 N 14th St
- 3205 Kingston Rd
- 3602 N 14th
- 1412 Donahoe Dr
- 304 E Detroit Ave
- 2223 Turner St
- 2117 Ashley Place
- 1600 Monument Rd
- 2023 Turner St
- 516 Shannon Rd
- 504 Shannon Rd
- 520 Shannon Rd
- 2527 Windsor Rd
- 500 Shannon Rd
- 2525 Windsor Rd
- 509 Shannon Rd
- 2521 Windsor Rd
- 2519 Windsor Rd
- 501 Shannon Rd
- 2535 Windsor Rd
- 524 Shannon Rd
- 513 Shannon Rd
- 2523 Windsor Rd
- 2517 Windsor Rd
- 2531 Windsor Rd
- 2529 Windsor Rd
- 2533 Windsor Rd
- 517 Shannon Rd
- 2515 Windsor Rd