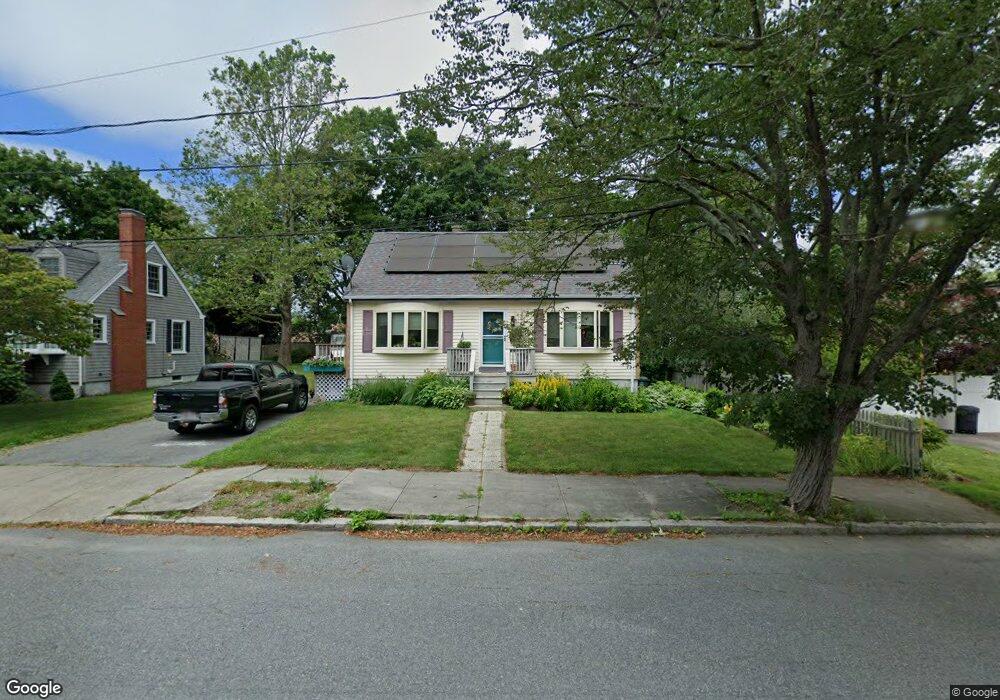
512 Sherman St Fall River, MA 02723
Bank Street NeighborhoodEstimated Value: $389,000 - $462,000
3
Beds
2
Baths
1,339
Sq Ft
$325/Sq Ft
Est. Value
About This Home
This home is located at 512 Sherman St, Fall River, MA 02723 and is currently estimated at $435,009, approximately $324 per square foot. 512 Sherman St is a home located in Bristol County with nearby schools including Mary Fonseca Elementary School, Talbot Innovation School, and B M C Durfee High School.
Ownership History
Date
Name
Owned For
Owner Type
Purchase Details
Closed on
Nov 3, 1986
Bought by
Leguyader Desire and Leguyader Marianne
Current Estimated Value
Create a Home Valuation Report for This Property
The Home Valuation Report is an in-depth analysis detailing your home's value as well as a comparison with similar homes in the area
Home Values in the Area
Average Home Value in this Area
Purchase History
| Date | Buyer | Sale Price | Title Company |
|---|---|---|---|
| Leguyader Desire | $112,000 | -- |
Source: Public Records
Mortgage History
| Date | Status | Borrower | Loan Amount |
|---|---|---|---|
| Open | Leguyader Desire | $75,000 | |
| Closed | Leguyader Desire | $112,000 | |
| Closed | Leguyader Desire | $30,000 |
Source: Public Records
Tax History
| Year | Tax Paid | Tax Assessment Tax Assessment Total Assessment is a certain percentage of the fair market value that is determined by local assessors to be the total taxable value of land and additions on the property. | Land | Improvement |
|---|---|---|---|---|
| 2025 | $4,238 | $370,100 | $143,300 | $226,800 |
| 2024 | $4,008 | $348,800 | $137,800 | $211,000 |
| 2023 | $4,042 | $329,400 | $119,100 | $210,300 |
| 2022 | $3,524 | $285,900 | $111,400 | $174,500 |
| 2021 | $3,524 | $254,800 | $111,700 | $143,100 |
| 2020 | $3,384 | $234,200 | $112,000 | $122,200 |
| 2019 | $3,377 | $231,600 | $113,700 | $117,900 |
| 2018 | $3,484 | $238,300 | $120,100 | $118,200 |
| 2017 | $3,223 | $230,200 | $114,300 | $115,900 |
| 2016 | $3,084 | $226,300 | $116,700 | $109,600 |
| 2015 | $2,812 | $215,000 | $102,600 | $112,400 |
| 2014 | $2,705 | $215,000 | $102,600 | $112,400 |
Source: Public Records
Map
Nearby Homes
Your Personal Tour Guide
Ask me questions while you tour the home.