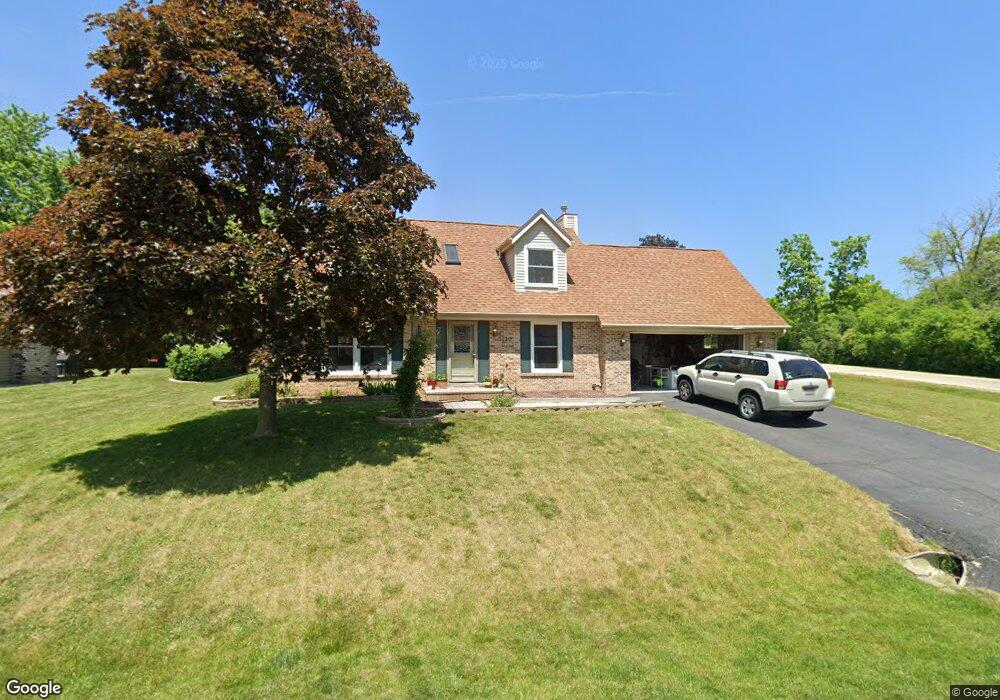
5120 Linden Ln Racine, WI 53406
Estimated Value: $316,000 - $402,000
4
Beds
2
Baths
1,638
Sq Ft
$216/Sq Ft
Est. Value
About This Home
This home is located at 5120 Linden Ln, Racine, WI 53406 and is currently estimated at $354,304, approximately $216 per square foot. 5120 Linden Ln is a home located in Racine County with nearby schools including Gifford Elementary School, Case High School, and St. John Fisher Academy.
Ownership History
Date
Name
Owned For
Owner Type
Purchase Details
Closed on
Oct 12, 2009
Sold by
Kupper Christopher and Helvick Kathryne
Bought by
Kupper Christopher and Kupper Kathryne
Current Estimated Value
Home Financials for this Owner
Home Financials are based on the most recent Mortgage that was taken out on this home.
Original Mortgage
$187,500
Outstanding Balance
$122,372
Interest Rate
5.07%
Mortgage Type
FHA
Estimated Equity
$231,932
Purchase Details
Closed on
Mar 12, 2007
Sold by
Federal National Mortgage Association
Bought by
Kupper Christopher
Home Financials for this Owner
Home Financials are based on the most recent Mortgage that was taken out on this home.
Original Mortgage
$45,225
Interest Rate
6.03%
Mortgage Type
New Conventional
Purchase Details
Closed on
Nov 21, 2006
Sold by
Larsen Dean and Larsen Evelyn
Bought by
Federal National Mortgage Association
Create a Home Valuation Report for This Property
The Home Valuation Report is an in-depth analysis detailing your home's value as well as a comparison with similar homes in the area
Home Values in the Area
Average Home Value in this Area
Purchase History
| Date | Buyer | Sale Price | Title Company |
|---|---|---|---|
| Kupper Christopher | -- | None Available | |
| Kupper Christopher | $180,900 | -- | |
| Federal National Mortgage Association | $177,800 | -- |
Source: Public Records
Mortgage History
| Date | Status | Borrower | Loan Amount |
|---|---|---|---|
| Open | Kupper Christopher | $187,500 | |
| Closed | Kupper Christopher | $45,225 | |
| Closed | Kupper Christopher | $135,675 |
Source: Public Records
Tax History Compared to Growth
Tax History
| Year | Tax Paid | Tax Assessment Tax Assessment Total Assessment is a certain percentage of the fair market value that is determined by local assessors to be the total taxable value of land and additions on the property. | Land | Improvement |
|---|---|---|---|---|
| 2024 | $4,475 | $294,300 | $40,400 | $253,900 |
| 2023 | $4,432 | $275,600 | $40,400 | $235,200 |
| 2022 | $3,855 | $248,500 | $40,400 | $208,100 |
| 2021 | $3,926 | $230,900 | $40,400 | $190,500 |
| 2020 | $3,812 | $193,200 | $36,700 | $156,500 |
| 2019 | $3,549 | $193,200 | $36,700 | $156,500 |
| 2018 | $3,472 | $168,800 | $36,700 | $132,100 |
| 2017 | $3,469 | $168,800 | $36,700 | $132,100 |
| 2016 | $3,413 | $169,200 | $36,700 | $132,500 |
| 2015 | $3,307 | $169,200 | $36,700 | $132,500 |
| 2014 | $3,174 | $169,200 | $36,700 | $132,500 |
| 2013 | $3,489 | $169,200 | $36,700 | $132,500 |
Source: Public Records
Map
Nearby Homes
- 2746 Manor Ave
- 3242 Bergamot Dr
- 3306 Bergamont Dr
- 3232 Bergamot Dr
- 6130 Northwestern Ave
- Thomas Plan at Auburn Hills
- Oakland Plan at Auburn Hills
- Kimberly Plan at Auburn Hills
- Springfield Plan at Auburn Hills
- 5625 Brookhaven Dr
- 3240 Blue Star Cir
- 3234 Blue Star Cir
- 5402 Cynthia Ln
- Weston Traditional Plan at Auburn Hills
- 2536 Green Haze Ave
- 2520 Amber Ln
- 2904 Old Mill Dr Unit B3
- 4940 Flambeau Dr
- 2132 Esquire Ln
- 4919 Flambeau Dr
- 5130 Linden Ln
- 3304 Twin Ln
- 5030 Bluebird Ln
- 5125 Linden Ln
- 5105 Linden Ln
- 5140 Linden Ln
- 5135 Linden Ln
- 3313 Twin Ln
- 5025 Bluebird Ln
- 5105 Twin Elms Dr
- 5115 Twin Elms Dr
- 3323 Twin Ln
- 5145 Linden Ln
- 5125 Twin Elms Dr
- 5014 Bluebird Ln
- 5130 Terrace High
- 5210 Linden Ln
- 5140 Terrace High
- 5023 Singing Trees Dr
- 5203 Twin Elms Dr