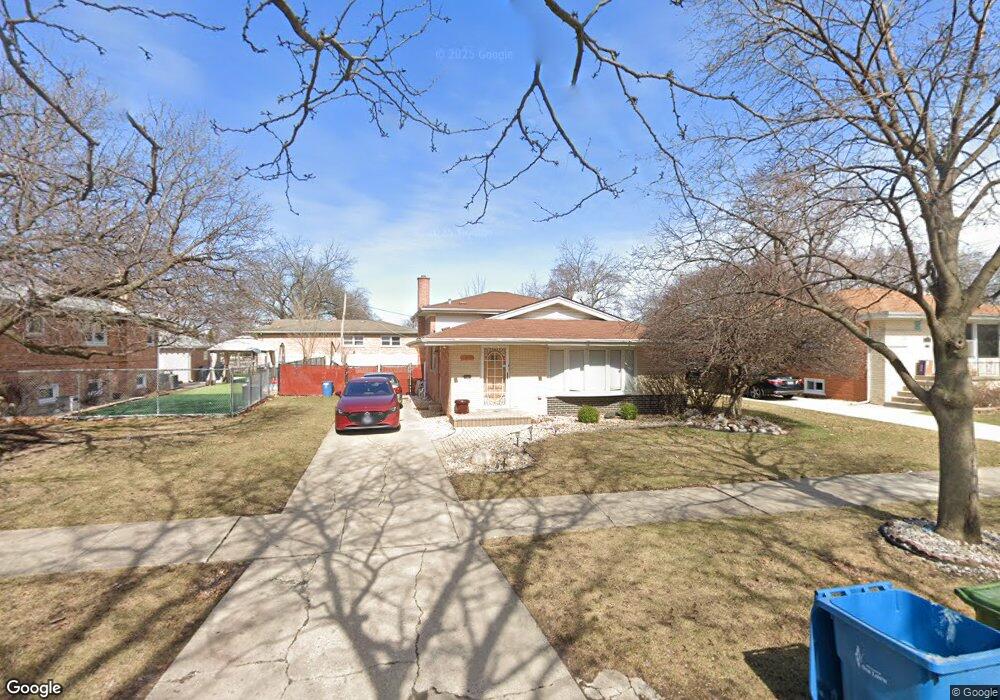
5120 W 91st St Oak Lawn, IL 60453
Estimated Value: $282,000 - $334,000
3
Beds
2
Baths
1,269
Sq Ft
$245/Sq Ft
Est. Value
About This Home
This home is located at 5120 W 91st St, Oak Lawn, IL 60453 and is currently estimated at $311,500, approximately $245 per square foot. 5120 W 91st St is a home located in Cook County with nearby schools including J Covington Elementary School, Hometown Elementary School, and Sward Elementary School.
Ownership History
Date
Name
Owned For
Owner Type
Purchase Details
Closed on
May 7, 2008
Sold by
Muhamad Fadia and Kurdi Jamal
Bought by
Kurdi Jamal and Muhamad Fadia
Current Estimated Value
Home Financials for this Owner
Home Financials are based on the most recent Mortgage that was taken out on this home.
Original Mortgage
$214,000
Outstanding Balance
$135,879
Interest Rate
5.93%
Mortgage Type
New Conventional
Estimated Equity
$175,621
Purchase Details
Closed on
Nov 1, 2004
Sold by
Hassan Adnan
Bought by
Muhamad Fadia
Home Financials for this Owner
Home Financials are based on the most recent Mortgage that was taken out on this home.
Original Mortgage
$50,000
Interest Rate
5.9%
Mortgage Type
Seller Take Back
Purchase Details
Closed on
May 9, 2000
Sold by
Balis Thomas J and Balis Joan M
Bought by
Hassan Adnan
Home Financials for this Owner
Home Financials are based on the most recent Mortgage that was taken out on this home.
Original Mortgage
$120,000
Interest Rate
8.37%
Create a Home Valuation Report for This Property
The Home Valuation Report is an in-depth analysis detailing your home's value as well as a comparison with similar homes in the area
Home Values in the Area
Average Home Value in this Area
Purchase History
| Date | Buyer | Sale Price | Title Company |
|---|---|---|---|
| Kurdi Jamal | -- | None Available | |
| Muhamad Fadia | $195,000 | Cti | |
| Hassan Adnan | $150,000 | -- |
Source: Public Records
Mortgage History
| Date | Status | Borrower | Loan Amount |
|---|---|---|---|
| Open | Kurdi Jamal | $214,000 | |
| Previous Owner | Muhamad Fadia | $50,000 | |
| Previous Owner | Hassan Adnan | $120,000 | |
| Closed | Hassan Adnan | $15,000 |
Source: Public Records
Tax History Compared to Growth
Tax History
| Year | Tax Paid | Tax Assessment Tax Assessment Total Assessment is a certain percentage of the fair market value that is determined by local assessors to be the total taxable value of land and additions on the property. | Land | Improvement |
|---|---|---|---|---|
| 2024 | $6,632 | $25,001 | $4,813 | $20,188 |
| 2023 | $6,170 | $25,001 | $4,813 | $20,188 |
| 2022 | $6,170 | $19,708 | $4,125 | $15,583 |
| 2021 | $6,067 | $19,708 | $4,125 | $15,583 |
| 2020 | $6,028 | $19,708 | $4,125 | $15,583 |
| 2019 | $5,961 | $19,865 | $3,781 | $16,084 |
| 2018 | $5,732 | $19,865 | $3,781 | $16,084 |
| 2017 | $5,763 | $19,865 | $3,781 | $16,084 |
| 2016 | $5,485 | $17,470 | $3,093 | $14,377 |
| 2015 | $5,379 | $17,470 | $3,093 | $14,377 |
| 2014 | $5,338 | $17,470 | $3,093 | $14,377 |
| 2013 | $5,710 | $20,377 | $3,093 | $17,284 |
Source: Public Records
Map
Nearby Homes
- 9047 S 50th Ave
- 9135 S 53rd Ave
- 5316 Otto Place
- 9005 S 49th Ct
- 9221 Raymond Ave
- 5232 Cass St
- 9212 S 49th Ct
- 9209 S 53rd Ct
- 9336 Tulley Ave
- 9246 S 49th Ave
- 9330 S 50th Ave
- 8737 Sproat Ave Unit 2
- 9402 Sproat Ave
- 9418 Tulley Ave
- 9001 S Cicero Ave Unit 132
- 9001 S Cicero Ave Unit 6
- 9001 S Cicero Ave Unit 81
- 9001 S Cicero Ave Unit 320
- 5500 W 90th St
- 9439 S 52nd Ave
- 5116 W 91st St
- 5124 W 91st St
- 9031 Tulley Ave
- 9027 Tulley Ave
- 9101 Tulley Ave
- 9101 Tulley Ave
- 9040 S 51st Ave
- 9044 S 51st Ave
- 9036 S 51st Ave
- 9032 S 51st Ave
- 5154 W 91st St
- 9105 Tulley Ave
- 9105 Tulley Ave
- 9100 S 51st Ave
- 9100 S 51st Ave
- 9028 S 51st Ave
- 9104 S 51st Ave
- 9104 S 51st Ave
- 9030 Tulley Ave
- 5158 W 91st St