Estimated Value: $387,000 - $438,000
3
Beds
1
Bath
2,180
Sq Ft
$192/Sq Ft
Est. Value
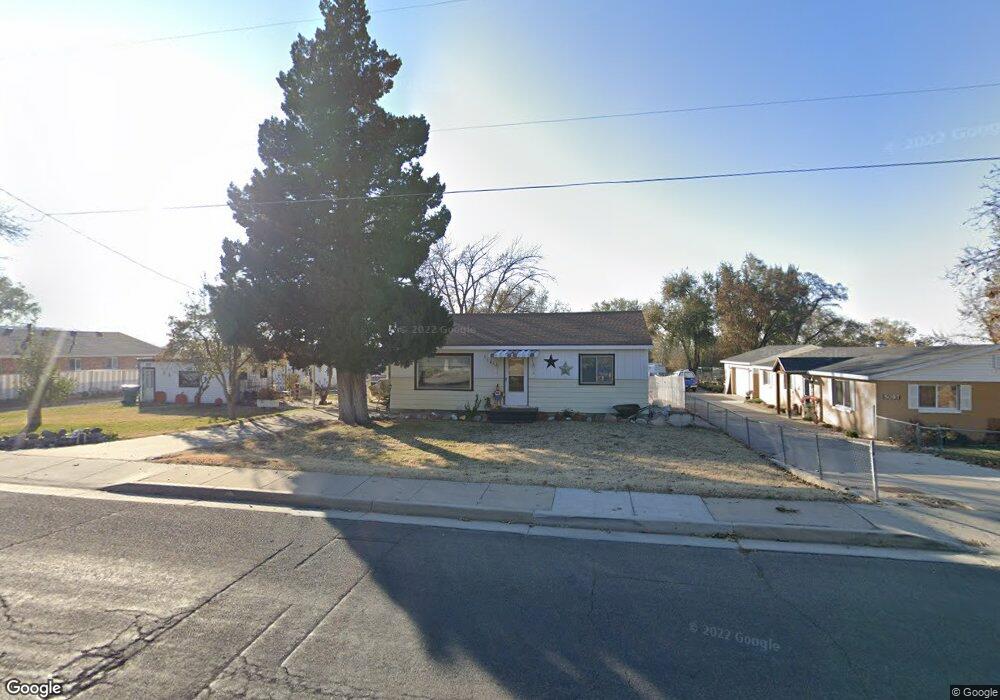
About This Home
This home is located at 5121 S 2700 W, Roy, UT 84067 and is currently estimated at $417,540, approximately $191 per square foot. 5121 S 2700 W is a home located in Weber County with nearby schools including Midland School, Sand Ridge Junior High School, and Roy High School.
Ownership History
Date
Name
Owned For
Owner Type
Purchase Details
Closed on
Nov 2, 2012
Sold by
Petro Kay and Peto Buckley N Kay
Bought by
Petro Buckley N Kay
Current Estimated Value
Purchase Details
Closed on
Nov 19, 2003
Sold by
Manning Kay Petro and Petro Norma Kay
Bought by
Petro Kay
Purchase Details
Closed on
Oct 26, 1998
Sold by
Petro Kay and Henderson Kay Petro
Bought by
Manning Kay Petro
Home Financials for this Owner
Home Financials are based on the most recent Mortgage that was taken out on this home.
Original Mortgage
$19,547
Interest Rate
6.6%
Create a Home Valuation Report for This Property
The Home Valuation Report is an in-depth analysis detailing your home's value as well as a comparison with similar homes in the area
Home Values in the Area
Average Home Value in this Area
Purchase History
| Date | Buyer | Sale Price | Title Company |
|---|---|---|---|
| Petro Buckley N Kay | -- | None Available | |
| Petro Kay | -- | -- | |
| Manning Kay Petro | -- | Associated Title |
Source: Public Records
Mortgage History
| Date | Status | Borrower | Loan Amount |
|---|---|---|---|
| Closed | Manning Kay Petro | $19,547 |
Source: Public Records
Tax History
| Year | Tax Paid | Tax Assessment Tax Assessment Total Assessment is a certain percentage of the fair market value that is determined by local assessors to be the total taxable value of land and additions on the property. | Land | Improvement |
|---|---|---|---|---|
| 2025 | $2,621 | $387,948 | $183,960 | $203,988 |
| 2024 | $2,569 | $211,812 | $101,191 | $110,621 |
| 2023 | $2,458 | $202,071 | $74,336 | $127,735 |
| 2022 | $2,609 | $220,001 | $68,994 | $151,007 |
| 2021 | $2,021 | $275,002 | $83,721 | $191,281 |
| 2020 | $1,792 | $222,002 | $83,721 | $138,281 |
| 2019 | $1,674 | $195,000 | $55,575 | $139,425 |
| 2018 | $1,503 | $163,998 | $52,411 | $111,587 |
| 2017 | $1,303 | $131,000 | $44,549 | $86,451 |
| 2016 | $1,111 | $58,678 | $21,085 | $37,593 |
| 2015 | $1,073 | $58,695 | $18,528 | $40,167 |
| 2014 | $854 | $43,443 | $18,528 | $24,915 |
Source: Public Records
Map
Nearby Homes
Your Personal Tour Guide
Ask me questions while you tour the home.