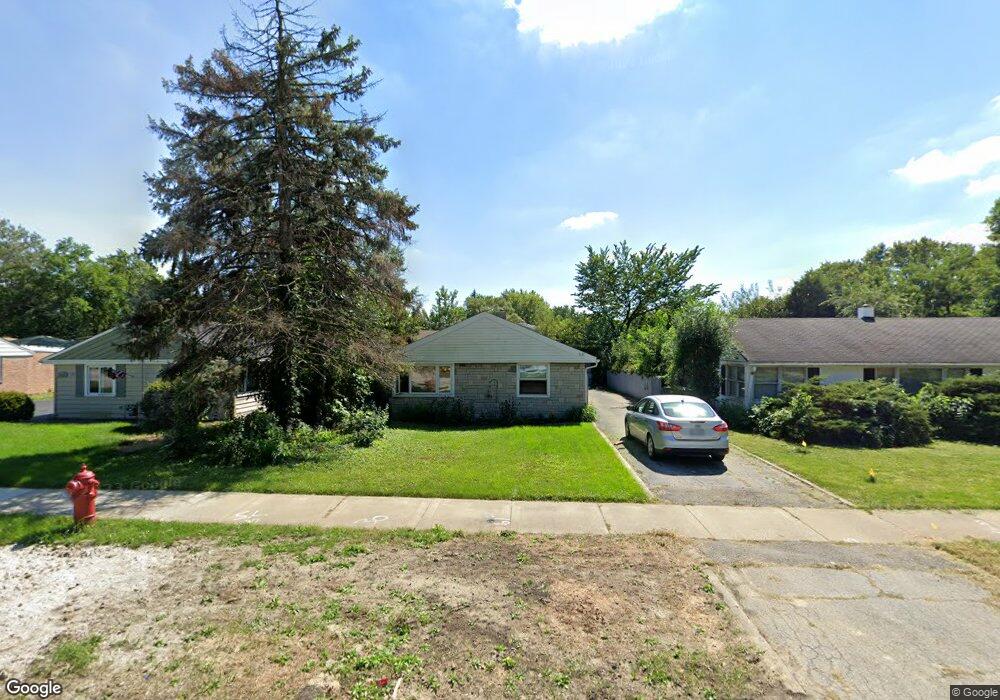
5121 W 99th St Unit 1 Oak Lawn, IL 60453
Estimated Value: $281,000 - $314,204
3
Beds
2
Baths
1,483
Sq Ft
$205/Sq Ft
Est. Value
About This Home
This home is located at 5121 W 99th St Unit 1, Oak Lawn, IL 60453 and is currently estimated at $303,801, approximately $204 per square foot. 5121 W 99th St Unit 1 is a home located in Cook County with nearby schools including Sward Elementary School, J Covington Elementary School, and Kolmar Avenue Elementary School.
Ownership History
Date
Name
Owned For
Owner Type
Purchase Details
Closed on
Apr 24, 2002
Sold by
Maher Gerald F
Bought by
Duerr John J
Current Estimated Value
Home Financials for this Owner
Home Financials are based on the most recent Mortgage that was taken out on this home.
Original Mortgage
$116,000
Interest Rate
6.95%
Mortgage Type
Balloon
Purchase Details
Closed on
Nov 28, 2001
Sold by
Arif Hamet
Bought by
Maher Gerald F
Purchase Details
Closed on
Jan 3, 1997
Sold by
Hickey Dolores M
Bought by
Arif Hamet
Home Financials for this Owner
Home Financials are based on the most recent Mortgage that was taken out on this home.
Original Mortgage
$118,916
Interest Rate
7.58%
Mortgage Type
FHA
Purchase Details
Closed on
May 12, 1995
Sold by
First National Bank Of Evergreen Park
Bought by
Hickey Dolores M
Home Financials for this Owner
Home Financials are based on the most recent Mortgage that was taken out on this home.
Original Mortgage
$96,000
Interest Rate
7.88%
Create a Home Valuation Report for This Property
The Home Valuation Report is an in-depth analysis detailing your home's value as well as a comparison with similar homes in the area
Home Values in the Area
Average Home Value in this Area
Purchase History
| Date | Buyer | Sale Price | Title Company |
|---|---|---|---|
| Duerr John J | -- | -- | |
| Maher Gerald F | -- | -- | |
| Arif Hamet | $120,000 | -- | |
| Hickey Dolores M | -- | -- |
Source: Public Records
Mortgage History
| Date | Status | Borrower | Loan Amount |
|---|---|---|---|
| Closed | Duerr John J | $116,000 | |
| Previous Owner | Arif Hamet | $118,916 | |
| Previous Owner | Hickey Dolores M | $96,000 | |
| Closed | Duerr John J | $21,700 |
Source: Public Records
Tax History Compared to Growth
Tax History
| Year | Tax Paid | Tax Assessment Tax Assessment Total Assessment is a certain percentage of the fair market value that is determined by local assessors to be the total taxable value of land and additions on the property. | Land | Improvement |
|---|---|---|---|---|
| 2024 | $6,183 | $23,222 | $4,536 | $18,686 |
| 2023 | $5,944 | $23,222 | $4,536 | $18,686 |
| 2022 | $5,944 | $18,498 | $3,969 | $14,529 |
| 2021 | $5,819 | $18,497 | $3,969 | $14,528 |
| 2020 | $5,848 | $18,497 | $3,969 | $14,528 |
| 2019 | $5,651 | $18,168 | $3,591 | $14,577 |
| 2018 | $5,437 | $18,168 | $3,591 | $14,577 |
| 2017 | $5,528 | $18,168 | $3,591 | $14,577 |
| 2016 | $4,483 | $13,958 | $3,024 | $10,934 |
| 2015 | $4,369 | $13,958 | $3,024 | $10,934 |
| 2014 | $4,327 | $13,958 | $3,024 | $10,934 |
| 2013 | $5,158 | $17,671 | $3,024 | $14,647 |
Source: Public Records
Map
Nearby Homes
- 5168 W 99th St
- 10010 Harnew Rd W Unit 1
- 10012 S 52nd Ave
- 10016 Harnew Rd W
- 10021 Cook Ave
- 9711 Tulley Ave
- 5120 W 101st St
- 9953 Elm Circle Dr
- 9706 S 52nd Ave
- 5125 W 101st St
- 9909 Elm Circle Dr
- 10100 Alice Ct
- 9828 Warren Ave
- 9904 S Cicero Ave
- 5100 W 96th St Unit 442
- 9735 S 55th Ave
- 5300 Oakdale Dr
- 5424 Franklin Ave
- 5509 Oak Center Dr
- 9821 S Cicero Ave Unit 8
- 5117 W 99th St Unit 1
- 5125 W 99th St
- 5113 W 99th St Unit 1
- 5129 W 99th St
- 5116 Oak Center Dr
- 5112 Oak Center Dr
- 5120 Oak Center Dr
- 5109 W 99th St
- 5133 W 99th St
- 5124 Oak Center Dr Unit 1
- 5108 Oak Center Dr
- 5152 W 99th St
- 5105 W 99th St Unit 1
- 5128 Oak Center Dr
- 5156 W 99th St
- 5137 W 99th St
- 5104 Oak Center Dr
- 5160 W 99th St
- 9843 Tulley Ave
- 9843 Tulley Ave