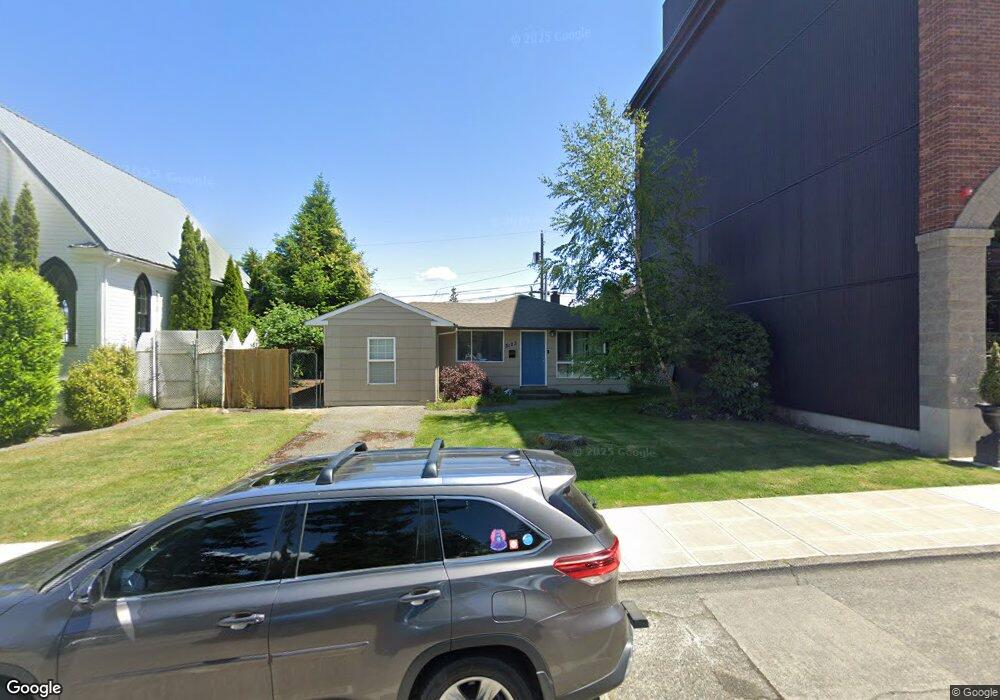
5123 N Pearl St Ruston, WA 98407
Estimated Value: $344,000 - $510,000
2
Beds
1
Bath
1,116
Sq Ft
$405/Sq Ft
Est. Value
About This Home
This home is located at 5123 N Pearl St, Ruston, WA 98407 and is currently estimated at $452,080, approximately $405 per square foot. 5123 N Pearl St is a home located in Pierce County with nearby schools including Point Defiance Elementary School, Truman Middle School, and Dr. Dolores Silas High School.
Ownership History
Date
Name
Owned For
Owner Type
Purchase Details
Closed on
Mar 5, 2015
Sold by
2005 Pearl Llc
Bought by
Brown Kenneth R and Brown Kathy A
Current Estimated Value
Home Financials for this Owner
Home Financials are based on the most recent Mortgage that was taken out on this home.
Original Mortgage
$128,804
Interest Rate
3.54%
Mortgage Type
Purchase Money Mortgage
Purchase Details
Closed on
Dec 4, 2006
Sold by
Krb Investments Llc
Bought by
2005 Pearl Llc
Purchase Details
Closed on
Mar 30, 2005
Sold by
Thrall Lindy
Bought by
Krb Investments Llc
Home Financials for this Owner
Home Financials are based on the most recent Mortgage that was taken out on this home.
Original Mortgage
$120,000
Interest Rate
5.6%
Mortgage Type
Purchase Money Mortgage
Create a Home Valuation Report for This Property
The Home Valuation Report is an in-depth analysis detailing your home's value as well as a comparison with similar homes in the area
Home Values in the Area
Average Home Value in this Area
Purchase History
| Date | Buyer | Sale Price | Title Company |
|---|---|---|---|
| Brown Kenneth R | -- | First American Title Ins Co | |
| 2005 Pearl Llc | -- | None Available | |
| Krb Investments Llc | $150,000 | First American Title Ins Co |
Source: Public Records
Mortgage History
| Date | Status | Borrower | Loan Amount |
|---|---|---|---|
| Closed | Brown Kenneth R | $128,804 | |
| Previous Owner | Krb Investments Llc | $120,000 |
Source: Public Records
Tax History
| Year | Tax Paid | Tax Assessment Tax Assessment Total Assessment is a certain percentage of the fair market value that is determined by local assessors to be the total taxable value of land and additions on the property. | Land | Improvement |
|---|---|---|---|---|
| 2025 | $3,639 | $431,900 | $311,600 | $120,300 |
| 2024 | $3,639 | $422,500 | $300,800 | $121,700 |
| 2023 | $3,639 | $388,800 | $260,900 | $127,900 |
| 2022 | $3,622 | $435,100 | $274,800 | $160,300 |
| 2021 | $3,327 | $305,900 | $175,000 | $130,900 |
| 2019 | $2,635 | $276,300 | $147,700 | $128,600 |
| 2018 | $2,794 | $254,300 | $133,200 | $121,100 |
| 2017 | $2,443 | $216,400 | $100,200 | $116,200 |
| 2016 | $2,288 | $162,800 | $75,700 | $87,100 |
| 2014 | $2,100 | $154,700 | $72,800 | $81,900 |
| 2013 | $2,100 | $141,300 | $65,200 | $76,100 |
Source: Public Records
Map
Nearby Homes
- 5217 N Winnifred St
- 5321 N Pearl St Unit 206
- 5008 N Visscher St
- 5302 N Shirley St
- 4945 N Pearl St
- 5301 N Commercial St
- 5313 N Commercial St
- 5028 N Whitman St
- 5032 N Villard St
- 5731 N 48th St
- 5302 N 49th St
- 5105 Grand Loop Unit 410
- 5321 N 48th St
- 6404 N 5 Views Rd
- 5917 N 46th St
- 4909 N Orchard St
- 4911 N Mildred St
- 5003 Main St Unit 108
- 6614 N 49th St
- 5707 N 45th St
- 5127 N Pearl St
- 5119 N Pearl St
- 5115 N Pearl St
- 5201 N Pearl St Unit RUS
- 5124 N Highland St
- 5128 N Highland St
- 5113 N Pearl St
- 5113 N Pearl St Unit A
- 5120 N Highland St
- 5124 to 5126 N Pearl St
- 5124 -5126 N Pearl St
- 5124 5126 N Pearl St
- 5124 N Pearl St
- 5202 N Highland St
- 5130 N Pearl St
- 5205 N Pearl St Unit RUS
- 5118 N Highland St
- 5208 N Highland St
- 5208 N Highland St
Your Personal Tour Guide
Ask me questions while you tour the home.