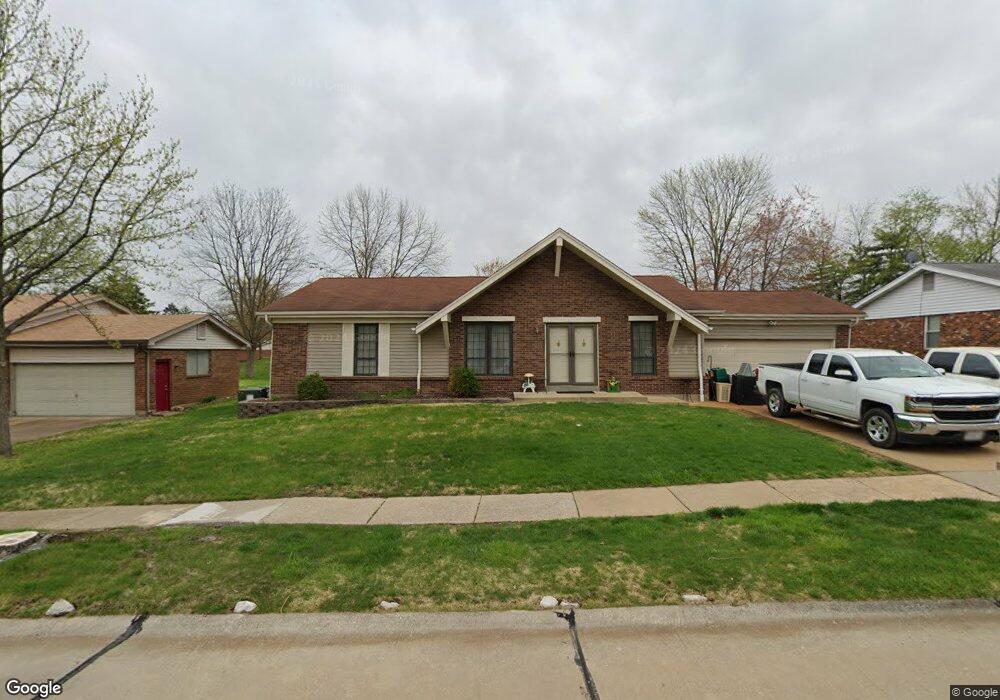
5124 Bryncastle Place Saint Louis, MO 63128
Estimated Value: $317,000 - $372,000
3
Beds
2
Baths
1,865
Sq Ft
$185/Sq Ft
Est. Value
About This Home
This home is located at 5124 Bryncastle Place, Saint Louis, MO 63128 and is currently estimated at $345,339, approximately $185 per square foot. 5124 Bryncastle Place is a home located in St. Louis County with nearby schools including Trautwein Elementary School, Washington Middle School, and Mehlville High School.
Ownership History
Date
Name
Owned For
Owner Type
Purchase Details
Closed on
Jun 7, 2019
Sold by
Kriegesmann Jay and Burkard Joyce
Bought by
Kriegesmann Jay and Burkard Joyce
Current Estimated Value
Purchase Details
Closed on
Oct 20, 2011
Sold by
Burkard Joyce Pauline and Kriegesmann Jay W
Bought by
Burkard Joyce Pauline and Kriegesmann Sr Jay William
Home Financials for this Owner
Home Financials are based on the most recent Mortgage that was taken out on this home.
Original Mortgage
$127,200
Interest Rate
4.13%
Mortgage Type
New Conventional
Purchase Details
Closed on
Mar 3, 2009
Sold by
Burkard Joyce Pauline and Kriegesmann Jay
Bought by
Burkard Joyce Pauline and Kriegesmann Jay
Home Financials for this Owner
Home Financials are based on the most recent Mortgage that was taken out on this home.
Original Mortgage
$164,529
Interest Rate
5.06%
Mortgage Type
Stand Alone Refi Refinance Of Original Loan
Purchase Details
Closed on
Dec 27, 2000
Sold by
Burkard Jay Clement
Bought by
Burkard Joyce Pauline
Create a Home Valuation Report for This Property
The Home Valuation Report is an in-depth analysis detailing your home's value as well as a comparison with similar homes in the area
Home Values in the Area
Average Home Value in this Area
Purchase History
| Date | Buyer | Sale Price | Title Company |
|---|---|---|---|
| Kriegesmann Jay | -- | None Available | |
| Burkard Joyce Pauline | -- | Investors Title Co Clayton | |
| Burkard Joyce Pauline | -- | None Available | |
| Burkard Joyce Pauline | -- | -- |
Source: Public Records
Mortgage History
| Date | Status | Borrower | Loan Amount |
|---|---|---|---|
| Closed | Burkard Joyce Pauline | $127,200 | |
| Closed | Burkard Joyce Pauline | $164,529 |
Source: Public Records
Tax History Compared to Growth
Tax History
| Year | Tax Paid | Tax Assessment Tax Assessment Total Assessment is a certain percentage of the fair market value that is determined by local assessors to be the total taxable value of land and additions on the property. | Land | Improvement |
|---|---|---|---|---|
| 2025 | $3,408 | $54,920 | $15,680 | $39,240 |
| 2024 | $3,408 | $50,700 | $13,950 | $36,750 |
| 2023 | $3,365 | $50,700 | $13,950 | $36,750 |
| 2022 | $2,933 | $44,370 | $12,180 | $32,190 |
| 2021 | $2,838 | $44,370 | $12,180 | $32,190 |
| 2020 | $2,709 | $40,270 | $9,580 | $30,690 |
| 2019 | $2,701 | $40,270 | $9,580 | $30,690 |
| 2018 | $2,682 | $36,100 | $8,720 | $27,380 |
| 2017 | $2,678 | $36,100 | $8,720 | $27,380 |
| 2016 | $2,768 | $35,810 | $8,720 | $27,090 |
| 2015 | $2,541 | $35,810 | $8,720 | $27,090 |
| 2014 | $2,604 | $36,340 | $7,330 | $29,010 |
Source: Public Records
Map
Nearby Homes
- 4540 Butler Hill Rd
- 4508 Frederickton Ct
- 5131 Butler Bend Dr
- 5161 Butler Bend Dr
- 5134 Butler Hill Ct
- 5251 Tuscan Chase Ct
- 4921 Kerth Rd
- 5417 Morningdale Place
- 5408 Medalton Way
- 5102 Peyton Place Ct
- 5057 Peyton Place Ct
- 5317 Hamlin Ct
- 13266 East Ln
- 13232 East Ln
- 5263 Faro Dr
- 4523 Beaver Brook Ct
- 4374 Bristol View Ct
- 4357 Bristol View Ct
- 4839 Hursley Dr
- 5401 Green Cedar Way Unit 6
- 5116 Bryncastle Place
- 5132 Bryncastle Place
- 5140 Bryncastle Place
- 5119 Bryncastle Place
- 5108 Bryncastle Place
- 5131 Bryncastle Place
- 4542 Castlegate Ct
- 5111 Bryncastle Place
- 5139 Bryncastle Place
- 5148 Bryncastle Place
- 5118 Castlegate Ct
- 5110 Castlegate Ct
- 4536 Castlegate Ct
- 5126 Castlegate Ct
- 4578 Castlegate Ct
- 5156 Bryncastle Place
- 5090 Bryncastle Place
- 5134 Castlegate Ct
- 4543 Castlegate Ct
- 5157 Bryncastle Place