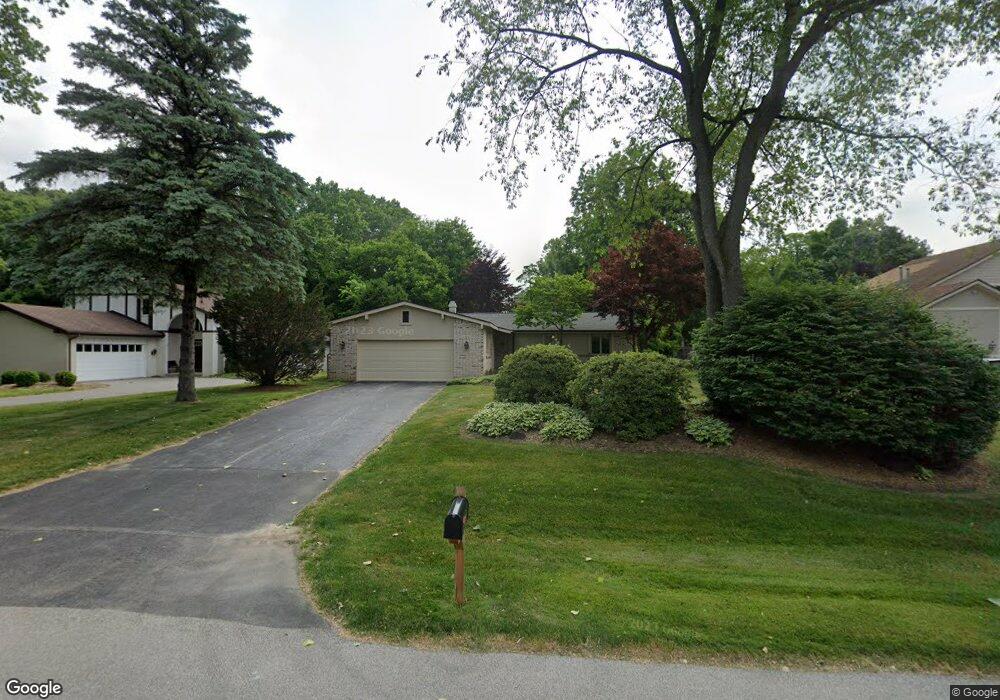
5124 Honora Dr Toledo, OH -4356
Estimated Value: $292,000 - $329,000
3
Beds
6
Baths
1,690
Sq Ft
$187/Sq Ft
Est. Value
About This Home
This home is located at 5124 Honora Dr, Toledo, OH -4356 and is currently estimated at $315,202, approximately $186 per square foot. 5124 Honora Dr is a home located in Lucas County with nearby schools including Maplewood Elementary School, Sylvania McCord Junior High School, and Sylvania Northview High School.
Ownership History
Date
Name
Owned For
Owner Type
Purchase Details
Closed on
Dec 21, 2023
Sold by
Berman Cinda R
Bought by
Worley Emily A and Taylor Brandon G
Current Estimated Value
Home Financials for this Owner
Home Financials are based on the most recent Mortgage that was taken out on this home.
Original Mortgage
$244,375
Outstanding Balance
$240,272
Interest Rate
7.44%
Mortgage Type
New Conventional
Estimated Equity
$74,930
Purchase Details
Closed on
Sep 24, 2009
Sold by
Berman Cinda R and Berman Todd W
Bought by
Berman Cinda R
Purchase Details
Closed on
Jun 14, 2002
Sold by
Bonanni Louis E and Bonanni Anne M
Bought by
Berman Cinda R
Purchase Details
Closed on
Oct 11, 1995
Sold by
Barnes James S
Bought by
Bonanni Louis E and Bonanni Anne M
Home Financials for this Owner
Home Financials are based on the most recent Mortgage that was taken out on this home.
Original Mortgage
$110,000
Interest Rate
7.8%
Mortgage Type
New Conventional
Create a Home Valuation Report for This Property
The Home Valuation Report is an in-depth analysis detailing your home's value as well as a comparison with similar homes in the area
Home Values in the Area
Average Home Value in this Area
Purchase History
| Date | Buyer | Sale Price | Title Company |
|---|---|---|---|
| Worley Emily A | $284,000 | None Listed On Document | |
| Berman Cinda R | -- | Attorney | |
| Berman Cinda R | $186,000 | -- | |
| Bonanni Louis E | $142,500 | -- |
Source: Public Records
Mortgage History
| Date | Status | Borrower | Loan Amount |
|---|---|---|---|
| Open | Worley Emily A | $244,375 | |
| Previous Owner | Bonanni Louis E | $110,000 |
Source: Public Records
Tax History Compared to Growth
Tax History
| Year | Tax Paid | Tax Assessment Tax Assessment Total Assessment is a certain percentage of the fair market value that is determined by local assessors to be the total taxable value of land and additions on the property. | Land | Improvement |
|---|---|---|---|---|
| 2024 | $3,336 | $101,465 | $23,170 | $78,295 |
| 2023 | $6,021 | $78,365 | $18,585 | $59,780 |
| 2022 | $6,023 | $78,365 | $18,585 | $59,780 |
| 2021 | $6,170 | $78,365 | $18,585 | $59,780 |
| 2020 | $5,767 | $64,820 | $15,365 | $49,455 |
| 2019 | $5,561 | $64,820 | $15,365 | $49,455 |
| 2018 | $5,232 | $64,820 | $15,365 | $49,455 |
| 2017 | $5,299 | $56,245 | $17,430 | $38,815 |
| 2016 | $5,201 | $160,700 | $49,800 | $110,900 |
| 2015 | $4,913 | $160,700 | $49,800 | $110,900 |
| 2014 | $4,675 | $54,080 | $16,770 | $37,310 |
| 2013 | $4,675 | $54,080 | $16,770 | $37,310 |
Source: Public Records
Map
Nearby Homes
- 5046 King Rd
- 7345 Country Commons Ln
- 7430 Country Commons Ln
- 7122 Brint Rd
- 4850 Tamworth Rd
- 5310 Turnberry Ln
- 4761 Tamworth Rd
- 4902 Marble Cliff Blvd
- 5060 Olde Mill Ct
- 4845 Westcliffe Ct
- 5308 Radcliffe Rd
- 7639 Cobblestone Dr
- 4731 Weldwood Ln
- 5144 Franciscan Blvd
- 7428 Kings Walk Ln
- 4610 Woodland Ln
- 4814 Sylvan Ct
- 5550 Olde Post Rd
- 6835 Brintwood Rd
- 7325 Winsford Ln
- 5124 Honora Dr
- 5132 Honora Dr
- 5116 Honora Dr
- 5140 Honora Dr
- 5108 Honora Dr
- 5129 Honora Dr
- 5115 Honora Dr
- 5146 Honora Dr
- 5062 Honora Dr
- 5149 Honora Dr
- 5056 Honora Dr
- 5158 Honora Dr
- 5061 Honora Dr
- 5126 Inland Dr
- 5130 Inland Dr
- 7254 Forest Brook Dr
- 5134 Inland Dr
- 5122 Inland Dr
- 5155 Honora Dr
- 5050 Honora Dr