Estimated Value: $323,000 - $374,000
4
Beds
2
Baths
2,050
Sq Ft
$170/Sq Ft
Est. Value
About This Home
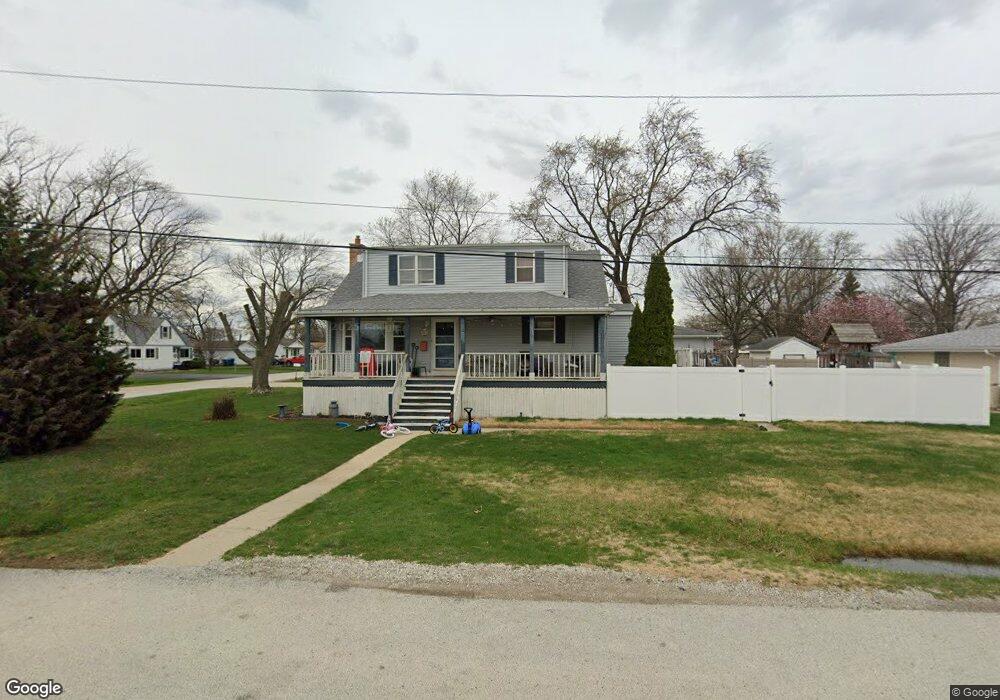
This home is located at 5124 W 120th Place, Alsip, IL 60803 and is currently estimated at $347,550, approximately $169 per square foot. 5124 W 120th Place is a home located in Cook County with nearby schools including Hazelgreen Elementary School, Prairie Jr High School, and A B Shepard High School.
Ownership History
Date
Name
Owned For
Owner Type
Purchase Details
Closed on
Sep 14, 2024
Sold by
Clark Alexander S and Clark Laura A
Bought by
Alexander S Clark And Laura A Clark Trust and Clark
Current Estimated Value
Purchase Details
Closed on
Jul 20, 2005
Sold by
Signore Dawn A and Ferrell Dawn A
Bought by
Clark Alexander S and Clark Laura A
Home Financials for this Owner
Home Financials are based on the most recent Mortgage that was taken out on this home.
Original Mortgage
$221,523
Interest Rate
5.8%
Mortgage Type
FHA
Purchase Details
Closed on
May 13, 1996
Sold by
Wollek Neil and Wollek Mary
Bought by
Signore Dawn A
Home Financials for this Owner
Home Financials are based on the most recent Mortgage that was taken out on this home.
Original Mortgage
$113,800
Interest Rate
7.85%
Purchase Details
Closed on
Jul 1, 1994
Sold by
Heniff Patricia M and Gestner Rita M
Bought by
Wollek Neil and Wollek Mary
Create a Home Valuation Report for This Property
The Home Valuation Report is an in-depth analysis detailing your home's value as well as a comparison with similar homes in the area
Home Values in the Area
Average Home Value in this Area
Purchase History
| Date | Buyer | Sale Price | Title Company |
|---|---|---|---|
| Alexander S Clark And Laura A Clark Trust | -- | None Listed On Document | |
| Clark Alexander S | $225,000 | Chicago Title Insurance Comp | |
| Signore Dawn A | $126,500 | Attorneys Natl Title Network | |
| Wollek Neil | $80,000 | -- |
Source: Public Records
Mortgage History
| Date | Status | Borrower | Loan Amount |
|---|---|---|---|
| Previous Owner | Clark Alexander S | $221,523 | |
| Previous Owner | Signore Dawn A | $113,800 |
Source: Public Records
Tax History Compared to Growth
Tax History
| Year | Tax Paid | Tax Assessment Tax Assessment Total Assessment is a certain percentage of the fair market value that is determined by local assessors to be the total taxable value of land and additions on the property. | Land | Improvement |
|---|---|---|---|---|
| 2024 | $6,853 | $24,000 | $5,671 | $18,329 |
| 2023 | $7,234 | $24,000 | $5,671 | $18,329 |
| 2022 | $7,234 | $21,431 | $3,544 | $17,887 |
| 2021 | $6,916 | $21,431 | $3,544 | $17,887 |
| 2020 | $6,921 | $21,431 | $3,544 | $17,887 |
| 2019 | $5,637 | $17,818 | $3,307 | $14,511 |
| 2018 | $5,424 | $17,818 | $3,307 | $14,511 |
| 2017 | $6,049 | $19,302 | $3,307 | $15,995 |
| 2016 | $4,562 | $14,264 | $2,835 | $11,429 |
| 2015 | $4,477 | $14,264 | $2,835 | $11,429 |
| 2014 | $3,477 | $11,933 | $2,835 | $9,098 |
| 2013 | $4,033 | $14,375 | $2,835 | $11,540 |
Source: Public Records
Map
Nearby Homes
- 11841 S Leamington Ave
- 5008 W 122nd St Unit 2B
- 11756 S Leamington Ave
- 11906 S Cicero Ave
- 12147 S Cicero Ave
- 11608 S Leamington Ave
- 12211 S Spencer St
- 4808 W 118th St
- 4804 W 118th St
- 4833 W 123rd Place
- 11601 S Lawler Ave
- 5311 W Mint Julip Dr Unit 301
- 4511 W Howdy Ln
- 11553 S Joalyce Dr
- 11534 S Lee Rd
- 5544 W Cal Sag Rd
- 5128 W 113th St
- 12417 S Orchard St
- 12715 S Laporte Ave
- 12421 S Orchard St
- 12055 S Leamington Ave
- 5106 W 120th Place
- 12051 S Leamington Ave
- 12050 S Leamington Ave
- 5046 W 120th Place
- 12027 S Leamington Ave
- 5113 W 120th Place
- 5109 W 120th Place
- 5105 W 120th Place
- 12010 S Leamington Ave
- 12023 S Leamington Ave
- 5042 W 120th Place
- 5053 W 120th Place
- 5125 W 120th Place
- 12040 S Lawler Ave
- 5146 W 120th Place
- 5049 W 120th Place
- 12021 S Leamington Ave
- 12000 S Leamington Ave
- 12030 S Lawler Ave