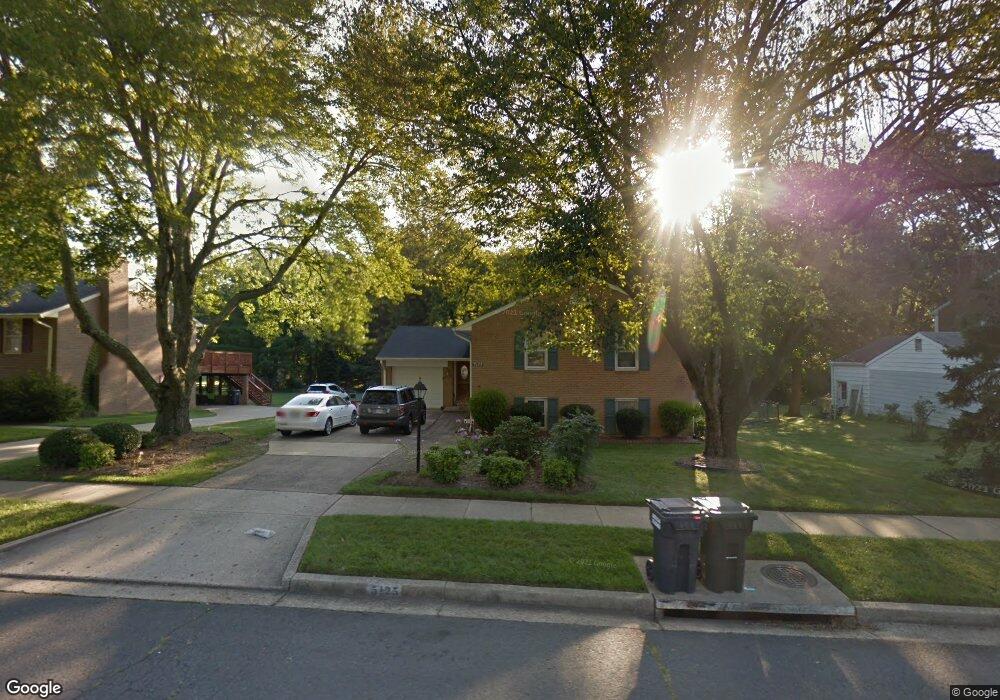
5125 Portsmouth Rd Fairfax, VA 22032
Estimated Value: $833,149 - $882,000
4
Beds
3
Baths
1,330
Sq Ft
$651/Sq Ft
Est. Value
About This Home
This home is located at 5125 Portsmouth Rd, Fairfax, VA 22032 and is currently estimated at $866,037, approximately $651 per square foot. 5125 Portsmouth Rd is a home located in Fairfax County with nearby schools including Oak View Elementary School, James W Robinson, Jr. Secondary School, and Trinity Christian School.
Ownership History
Date
Name
Owned For
Owner Type
Purchase Details
Closed on
Apr 2, 2003
Sold by
Park Sung S
Bought by
Lee Shin C
Current Estimated Value
Home Financials for this Owner
Home Financials are based on the most recent Mortgage that was taken out on this home.
Original Mortgage
$280,000
Outstanding Balance
$121,434
Interest Rate
5.88%
Mortgage Type
New Conventional
Estimated Equity
$744,603
Purchase Details
Closed on
Jan 31, 2001
Sold by
Asset Management Holdings
Bought by
Park Sung Soo
Home Financials for this Owner
Home Financials are based on the most recent Mortgage that was taken out on this home.
Original Mortgage
$259,000
Interest Rate
7.13%
Purchase Details
Closed on
Dec 28, 1999
Sold by
Prof Foreclosure Co Of Va
Bought by
Asset Management Holdings Llc
Create a Home Valuation Report for This Property
The Home Valuation Report is an in-depth analysis detailing your home's value as well as a comparison with similar homes in the area
Home Values in the Area
Average Home Value in this Area
Purchase History
| Date | Buyer | Sale Price | Title Company |
|---|---|---|---|
| Lee Shin C | $380,000 | -- | |
| Park Sung Soo | $288,000 | -- | |
| Asset Management Holdings Llc | $17,000 | -- |
Source: Public Records
Mortgage History
| Date | Status | Borrower | Loan Amount |
|---|---|---|---|
| Open | Lee Shin C | $280,000 | |
| Previous Owner | Park Sung Soo | $259,000 |
Source: Public Records
Tax History Compared to Growth
Tax History
| Year | Tax Paid | Tax Assessment Tax Assessment Total Assessment is a certain percentage of the fair market value that is determined by local assessors to be the total taxable value of land and additions on the property. | Land | Improvement |
|---|---|---|---|---|
| 2025 | $8,642 | $797,030 | $299,000 | $498,030 |
| 2024 | $8,642 | $745,980 | $279,000 | $466,980 |
| 2023 | $8,121 | $719,640 | $279,000 | $440,640 |
| 2022 | $7,795 | $681,660 | $259,000 | $422,660 |
| 2021 | $6,995 | $596,120 | $234,000 | $362,120 |
| 2020 | $6,864 | $580,000 | $233,000 | $347,000 |
| 2019 | $6,864 | $580,000 | $233,000 | $347,000 |
| 2018 | $6,378 | $554,570 | $214,000 | $340,570 |
| 2017 | $6,551 | $564,220 | $214,000 | $350,220 |
| 2016 | $6,450 | $556,720 | $210,000 | $346,720 |
| 2015 | $6,033 | $540,620 | $204,000 | $336,620 |
| 2014 | $5,820 | $522,670 | $199,000 | $323,670 |
Source: Public Records
Map
Nearby Homes
- 10710 Almond St
- 0 Joshua Davis Ct
- 10271 Braddock Rd
- 10708 Rippon Lodge Dr
- 10255 Braddock Rd
- 10212 Provincetown Ct
- 10919 Spurlock Ct
- 4768 Farndon Ct
- 4607 Tapestry Dr
- 4773 Farndon Ct
- 10402 Hollyoak Place
- 10196 Red Spruce Rd
- 4316 Chain Bridge Rd
- 11123 Popes Head Rd
- 10404 Forest Ave
- 5503 Fireside Ct
- 5538 Shooters Hill Ln
- 10231 Aspen Willow Dr
- 10496 Courtney Dr
- 10134 Red Spruce Rd
- 5123 Portsmouth Rd
- 5121 Portsmouth Rd
- 5129 Portsmouth Rd
- 4916 Gadsen Dr
- 5119 Portsmouth Rd
- 10701 Buckingham Rd
- 5131 Portsmouth Rd
- 10700 Buckingham Rd
- 4914 Gadsen Dr
- 5128 Portsmouth Rd
- 4918 Gadsen Dr
- 4920 Gadsen Dr
- 5120 Portsmouth Rd
- 4922 Gadsen Dr
- 4912 Gadsen Dr
- 5130 Portsmouth Rd
- 5133 Portsmouth Rd
- 10703 Buckingham Rd
- 5115 Portsmouth Rd
- 10606 Henrico St