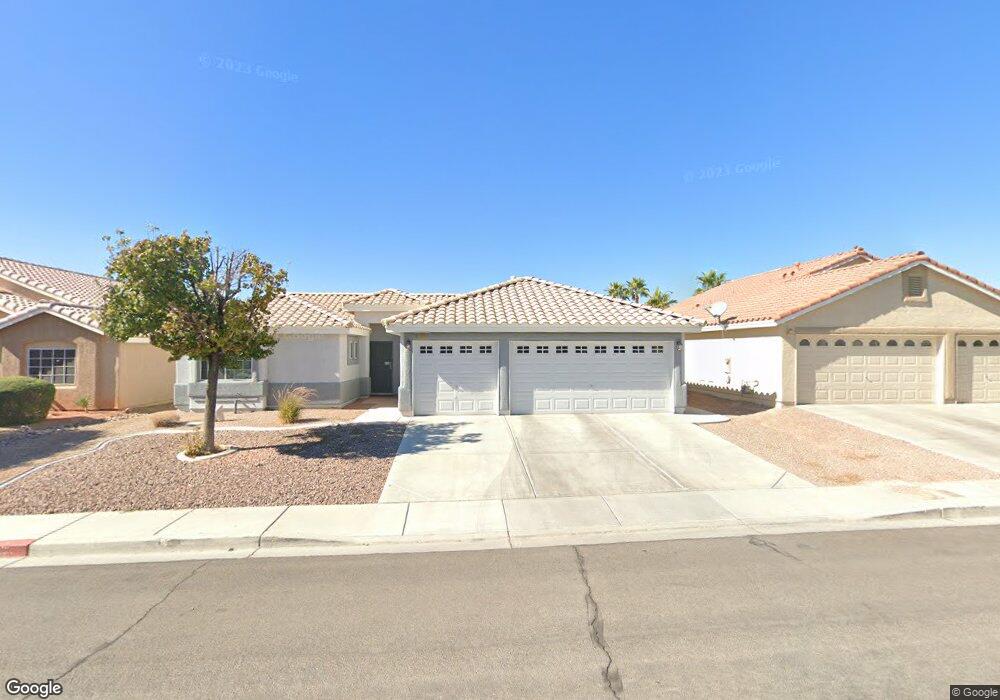
5125 Stone Cove St North Las Vegas, NV 89081
Northridge NeighborhoodEstimated Value: $386,767 - $415,000
3
Beds
2
Baths
1,607
Sq Ft
$252/Sq Ft
Est. Value
About This Home
This home is located at 5125 Stone Cove St, North Las Vegas, NV 89081 and is currently estimated at $404,692, approximately $251 per square foot. 5125 Stone Cove St is a home located in Clark County with nearby schools including Jesse D. Scott Elementary School, Clifford O. Findlay Middle School, and Mojave High School.
Ownership History
Date
Name
Owned For
Owner Type
Purchase Details
Closed on
Jul 16, 2021
Sold by
Butler Paul A and Blackey Terri J
Bought by
Rs Xii Las Vegas Owner 1 Lp
Current Estimated Value
Purchase Details
Closed on
Jun 6, 2017
Sold by
Armstrong Jack
Bought by
Butler Paul A
Home Financials for this Owner
Home Financials are based on the most recent Mortgage that was taken out on this home.
Original Mortgage
$164,250
Interest Rate
4.03%
Mortgage Type
New Conventional
Purchase Details
Closed on
Jun 15, 2011
Sold by
Kim Hannah
Bought by
Franch Andrew
Purchase Details
Closed on
Jul 12, 2010
Sold by
Cromwell David
Bought by
Franch Andrew
Purchase Details
Closed on
Sep 26, 2003
Sold by
D R Horton Inc
Bought by
Cromwell David
Home Financials for this Owner
Home Financials are based on the most recent Mortgage that was taken out on this home.
Original Mortgage
$182,850
Interest Rate
6.22%
Mortgage Type
Unknown
Create a Home Valuation Report for This Property
The Home Valuation Report is an in-depth analysis detailing your home's value as well as a comparison with similar homes in the area
Home Values in the Area
Average Home Value in this Area
Purchase History
| Date | Buyer | Sale Price | Title Company |
|---|---|---|---|
| Rs Xii Las Vegas Owner 1 Lp | $351,000 | First American Title Insu | |
| Butler Paul A | $219,000 | First American Title Ins | |
| Franch Andrew | -- | National Title Company | |
| Armstrong Jack | $111,000 | National Title Company | |
| Franch Andrew | $94,500 | National Title Company | |
| Cromwell David | $192,474 | United Title Of Nevada |
Source: Public Records
Mortgage History
| Date | Status | Borrower | Loan Amount |
|---|---|---|---|
| Previous Owner | Butler Paul A | $164,250 | |
| Previous Owner | Cromwell David | $182,850 |
Source: Public Records
Tax History Compared to Growth
Tax History
| Year | Tax Paid | Tax Assessment Tax Assessment Total Assessment is a certain percentage of the fair market value that is determined by local assessors to be the total taxable value of land and additions on the property. | Land | Improvement |
|---|---|---|---|---|
| 2025 | $1,461 | $105,165 | $33,600 | $71,565 |
| 2024 | $1,419 | $105,165 | $33,600 | $71,565 |
| 2023 | $1,419 | $100,226 | $32,550 | $67,676 |
| 2022 | $1,378 | $87,264 | $25,550 | $61,714 |
| 2021 | $1,338 | $81,682 | $23,100 | $58,582 |
| 2020 | $1,296 | $79,097 | $21,000 | $58,097 |
| 2019 | $1,258 | $74,894 | $17,850 | $57,044 |
| 2018 | $1,221 | $66,487 | $14,350 | $52,137 |
| 2017 | $2,015 | $60,079 | $14,000 | $46,079 |
| 2016 | $1,157 | $54,245 | $10,500 | $43,745 |
| 2015 | $1,157 | $35,389 | $7,000 | $28,389 |
| 2014 | $1,120 | $34,386 | $5,250 | $29,136 |
Source: Public Records
Map
Nearby Homes
- 5120 First Sun St
- 1014 Emerald Stone Ave
- 1109 Jewel Springs Ln
- 1106 Emerald Stone Ave
- 1014 Cliffbrook Hedge Ave
- 1022 Cliffbrook Hedge Ave Unit 3
- 5013 Drifting Pebble St
- 1214 Emerald Stone Ave
- 5308 La Quinta Hills St
- 4935 Stormy Ridge St
- 5208 Ponderosa Heights St
- 1014 Edgestone Mark Ave
- 1408 Laughing Larkspur Ave
- 609 El Gusto Ave
- 1113 E Hammer Ln
- 1405 Fantastic Ct
- 505 El Gusto Ave
- 4848 Cutting Diamond Ct
- 1413 Fantastic Ct
- Residence 2119 Plan at Bravado
- 5121 Stone Cove St
- 5129 Stone Cove St
- 5126 Pebble Rim St
- 5122 Pebble Rim St
- 5130 Pebble Rim St Unit 1
- 5117 Stone Cove St
- 5122 Stone Cove St Unit 1
- 5126 Stone Cove St
- 5118 Pebble Rim St
- 5118 Stone Cove St
- 5113 Stone Cove St
- 918 Boca Glen Rd
- 5114 Pebble Rim St
- 914 Boca Glen Rd
- 914 Boca Glen Rd
- 5114 Stone Cove St
- 5134 Stone Cove St Unit 1
- 910 Boca Glen Rd
- 5109 Stone Cove St
- 5127 Canary Lark St