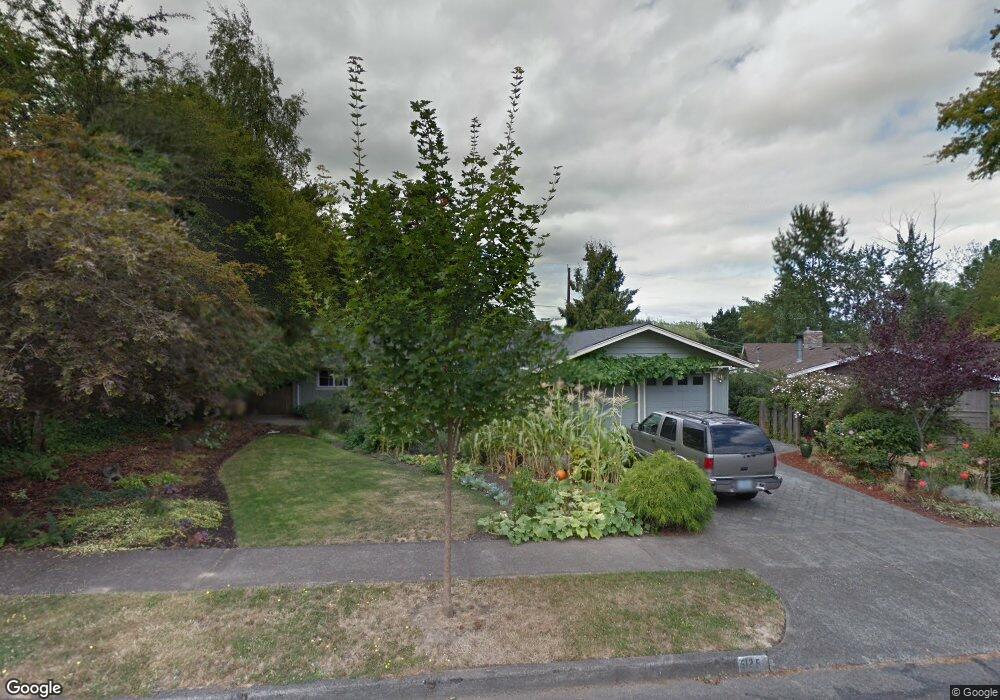
5125 SW Elm Ave Beaverton, OR 97005
Raleigh West NeighborhoodEstimated Value: $606,000 - $652,000
3
Beds
2
Baths
1,635
Sq Ft
$381/Sq Ft
Est. Value
About This Home
This home is located at 5125 SW Elm Ave, Beaverton, OR 97005 and is currently estimated at $622,305, approximately $380 per square foot. 5125 SW Elm Ave is a home located in Washington County with nearby schools including Raleigh Hills Elementary School, Whitford Middle School, and Beaverton High School.
Ownership History
Date
Name
Owned For
Owner Type
Purchase Details
Closed on
Sep 14, 2015
Sold by
Laughlin James E and Laughlin Sarah S
Bought by
Mclean Terry and Barrett Annin K
Current Estimated Value
Home Financials for this Owner
Home Financials are based on the most recent Mortgage that was taken out on this home.
Original Mortgage
$305,000
Outstanding Balance
$237,821
Interest Rate
3.86%
Mortgage Type
New Conventional
Estimated Equity
$384,484
Purchase Details
Closed on
Aug 21, 1997
Sold by
Lurie Jonathan
Bought by
Laughlin James E and Laughlin Sarah S
Home Financials for this Owner
Home Financials are based on the most recent Mortgage that was taken out on this home.
Original Mortgage
$149,600
Interest Rate
7.45%
Purchase Details
Closed on
Jul 5, 1995
Sold by
Stieger Paul J and Stieger Joan M
Bought by
Lurie Jonathan
Home Financials for this Owner
Home Financials are based on the most recent Mortgage that was taken out on this home.
Original Mortgage
$115,200
Interest Rate
6.5%
Create a Home Valuation Report for This Property
The Home Valuation Report is an in-depth analysis detailing your home's value as well as a comparison with similar homes in the area
Home Values in the Area
Average Home Value in this Area
Purchase History
| Date | Buyer | Sale Price | Title Company |
|---|---|---|---|
| Mclean Terry | $387,500 | Chicago Title Company Of Or | |
| Laughlin James E | $157,500 | Oregon Title Insurance Co | |
| Lurie Jonathan | $128,000 | Chicago Title |
Source: Public Records
Mortgage History
| Date | Status | Borrower | Loan Amount |
|---|---|---|---|
| Open | Mclean Terry | $305,000 | |
| Previous Owner | Laughlin James E | $149,600 | |
| Previous Owner | Lurie Jonathan | $115,200 |
Source: Public Records
Tax History Compared to Growth
Tax History
| Year | Tax Paid | Tax Assessment Tax Assessment Total Assessment is a certain percentage of the fair market value that is determined by local assessors to be the total taxable value of land and additions on the property. | Land | Improvement |
|---|---|---|---|---|
| 2026 | $6,895 | $336,610 | -- | -- |
| 2025 | $6,895 | $326,810 | -- | -- |
| 2024 | $6,510 | $317,300 | -- | -- |
| 2023 | $6,510 | $308,060 | $0 | $0 |
| 2022 | $6,231 | $308,060 | $0 | $0 |
| 2021 | $6,013 | $290,380 | $0 | $0 |
| 2020 | $5,830 | $281,930 | $0 | $0 |
| 2019 | $5,645 | $273,720 | $0 | $0 |
| 2018 | $5,465 | $265,750 | $0 | $0 |
| 2017 | $5,261 | $258,010 | $0 | $0 |
| 2016 | $5,078 | $250,500 | $0 | $0 |
| 2015 | $4,415 | $219,630 | $0 | $0 |
| 2014 | $4,321 | $213,240 | $0 | $0 |
Source: Public Records
Map
Nearby Homes
- 10090 SW Beaverton Hillsdale Hwy Unit 13
- 10090 SW Beaverton Hillsdale Hwy Unit 16
- 4800 SW Chestnut Place
- 9355 SW Jamieson Rd
- 4387 SW 94th Ave Unit 3
- 9360 SW Meadow Ln
- 5805 SW Arrow Wood Ln
- 6025 SW Spruce Ave
- 8920 SW Jamieson Rd
- 8955 SW Club Meadow Ln
- 6075 SW Arrow Wood Ln
- 6220 SW Spruce Ave
- 5455 SW 87th Ave
- 3760 SW 96th Ave
- 8725 SW White Pine Ln
- 5488 SW Alger Ave Unit I-7
- 10405 SW Denney Rd Unit 90
- 10405 SW Denney Rd Unit 93
- 5436 SW Champion Place
- 5555 SW Scholls Ferry Rd
- 5155 SW Elm Ave
- 5105 SW Elm Ave
- 5175 SW Elm Ave
- 5120 SW Elm Ave
- 9970 SW Cypress St Unit 1
- 9970 SW Cypress St
- 5170 SW Elm Ave
- 5055 SW Elm Ave
- 5195 SW Elm Ave
- 9995 SW Cypress St
- 9950 SW Cypress St
- 5205 SW Elm Ave
- 5210 SW Elm Ave
- 9975 SW Cypress St
- 5125 SW Chestnut Ave
- 5105 SW Chestnut Ave
- 9955 SW Cypress St
- 5220 SW Elm Ave
- 10080 SW 5th St
- 5215 SW Elm Ave