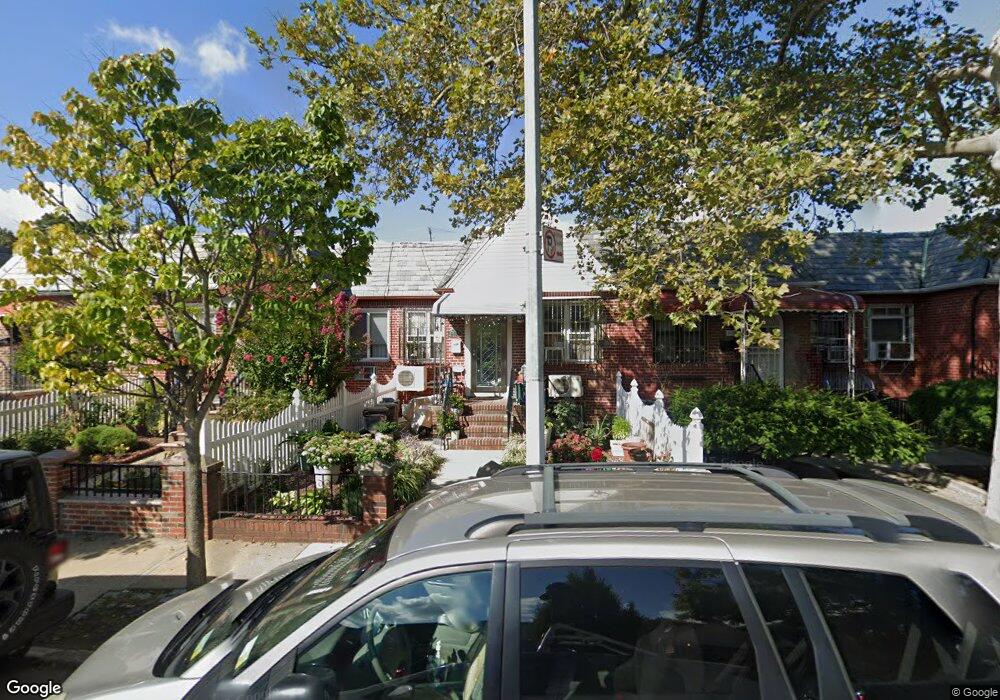
5126 Ireland St Elmhurst, NY 11373
Elmhurst NeighborhoodEstimated Value: $817,000 - $1,041,000
--
Bed
--
Bath
930
Sq Ft
$1,016/Sq Ft
Est. Value
About This Home
This home is located at 5126 Ireland St, Elmhurst, NY 11373 and is currently estimated at $945,000, approximately $1,016 per square foot. 5126 Ireland St is a home located in Queens County with nearby schools including P.S. 102 Bayview, Is 5 The Walter Crowley Intermediate School, and Newtown High School.
Ownership History
Date
Name
Owned For
Owner Type
Purchase Details
Closed on
Jan 31, 2011
Sold by
Chien Yi-Ren and Chien Yu-Yen Lin
Bought by
Chien Christina H and Chien Yu-Yen Lin
Current Estimated Value
Purchase Details
Closed on
May 26, 2005
Sold by
Park Jeong Sug
Bought by
Chien Yi Ren and Chien Yu-Yen Lin
Home Financials for this Owner
Home Financials are based on the most recent Mortgage that was taken out on this home.
Original Mortgage
$150,000
Interest Rate
5.79%
Mortgage Type
Purchase Money Mortgage
Purchase Details
Closed on
Mar 26, 2001
Sold by
Kim Sung Hui
Bought by
Park Jeong Sug
Purchase Details
Closed on
Nov 4, 1999
Sold by
Toot Janet W and Long Lillian
Bought by
Kim Sung Hui
Home Financials for this Owner
Home Financials are based on the most recent Mortgage that was taken out on this home.
Original Mortgage
$203,324
Interest Rate
7.61%
Create a Home Valuation Report for This Property
The Home Valuation Report is an in-depth analysis detailing your home's value as well as a comparison with similar homes in the area
Home Values in the Area
Average Home Value in this Area
Purchase History
| Date | Buyer | Sale Price | Title Company |
|---|---|---|---|
| Chien Christina H | $249,000 | -- | |
| Chien Yi Ren | $498,000 | -- | |
| Park Jeong Sug | -- | Stewart Title | |
| Kim Sung Hui | $205,000 | -- |
Source: Public Records
Mortgage History
| Date | Status | Borrower | Loan Amount |
|---|---|---|---|
| Previous Owner | Chien Yi Ren | $150,000 | |
| Previous Owner | Kim Sung Hui | $203,324 |
Source: Public Records
Tax History Compared to Growth
Tax History
| Year | Tax Paid | Tax Assessment Tax Assessment Total Assessment is a certain percentage of the fair market value that is determined by local assessors to be the total taxable value of land and additions on the property. | Land | Improvement |
|---|---|---|---|---|
| 2025 | $7,585 | $40,032 | $11,450 | $28,582 |
| 2024 | $7,585 | $37,766 | $12,697 | $25,069 |
| 2023 | $7,156 | $35,630 | $11,526 | $24,104 |
| 2022 | $7,199 | $53,400 | $16,440 | $36,960 |
| 2021 | $6,070 | $49,140 | $16,440 | $32,700 |
| 2020 | $6,765 | $49,200 | $16,440 | $32,760 |
| 2019 | $6,291 | $42,960 | $16,440 | $26,520 |
| 2018 | $5,755 | $29,692 | $9,982 | $19,710 |
| 2017 | $5,722 | $29,539 | $12,282 | $17,257 |
| 2016 | $5,261 | $29,539 | $12,282 | $17,257 |
| 2015 | $3,141 | $27,800 | $13,082 | $14,718 |
| 2014 | $3,141 | $26,227 | $13,028 | $13,199 |
Source: Public Records
Map
Nearby Homes
- 5119 Ireland St
- 74-49 Calamus Cir Unit 3rd FL
- 74-47 Calamus Ave Unit 48
- 79-19 Calamus Ave
- 73-37 52nd Ave
- 79-15 Kneeland Ave
- 0 Island Rd Unit S1604113
- 7408 46th Ave
- 78-06 46th Ave Unit 6F
- 78-06 46th Ave Unit 6C
- 78-06 46th Ave Unit 2
- 84-38 Grand Ave
- 7204 Calamus Ave
- 81-14 Queens Blvd Unit PH6C
- 71-22 Calamus Ave
- 4607 79th St
- 51-23 71st St
- 80-06 47th Ave Unit 1E
- 8006 47th Ave Unit 5A
- 5157 71st St
- 5128 Ireland St
- 5124 Ireland St
- 51-28 Ireland St
- 5122 Ireland St
- 5130 Ireland St
- 5120 Ireland St
- 5132 Ireland St
- 5118 Ireland St
- 5134 Ireland St
- 5119 Jacobus St
- 5117 Jacobus St
- 5115 Jacobus St
- 5116 Ireland St
- 5111 Jacobus St
- 5109 Jacobus St
- 51-07 Jacobus St
- 5114 Ireland St
- 5107 Jacobus St
- 5105 Jacobus St
- 5110 Ireland St