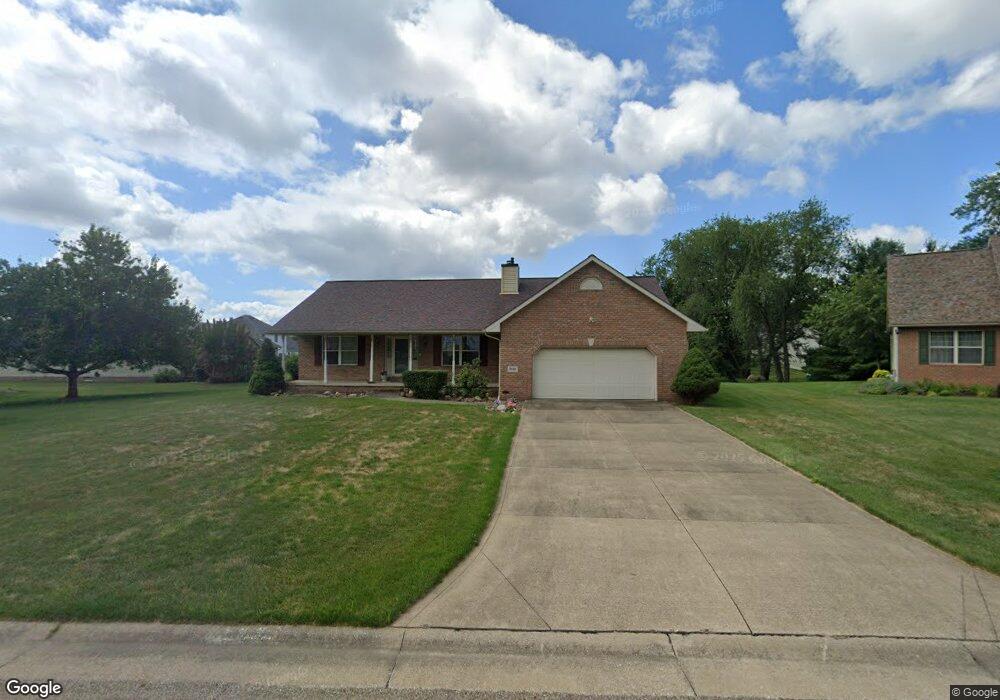
5126 Techwood St NW North Canton, OH 44720
Estimated Value: $291,317 - $361,000
3
Beds
2
Baths
1,650
Sq Ft
$196/Sq Ft
Est. Value
About This Home
This home is located at 5126 Techwood St NW, North Canton, OH 44720 and is currently estimated at $324,079, approximately $196 per square foot. 5126 Techwood St NW is a home located in Stark County with nearby schools including Lake Cable Elementary School, Jackson Memorial Middle School, and Jackson High School.
Ownership History
Date
Name
Owned For
Owner Type
Purchase Details
Closed on
Apr 29, 2010
Sold by
Loughry Jerry K
Bought by
Welling James Joseph
Current Estimated Value
Home Financials for this Owner
Home Financials are based on the most recent Mortgage that was taken out on this home.
Original Mortgage
$136,000
Outstanding Balance
$91,021
Interest Rate
5.02%
Mortgage Type
Purchase Money Mortgage
Estimated Equity
$233,058
Purchase Details
Closed on
Feb 29, 2004
Sold by
Loughry Alean R
Bought by
Loughry Alean R and Alean R Loughry Revocable Trust
Purchase Details
Closed on
May 12, 1997
Sold by
Rea Building Corp
Bought by
Loughry Roy W and Loughry Alean R
Purchase Details
Closed on
Oct 9, 1996
Sold by
Realty One Land Co Ltd
Bought by
Rea Building Corp
Purchase Details
Closed on
May 13, 1994
Purchase Details
Closed on
Aug 4, 1992
Create a Home Valuation Report for This Property
The Home Valuation Report is an in-depth analysis detailing your home's value as well as a comparison with similar homes in the area
Home Values in the Area
Average Home Value in this Area
Purchase History
| Date | Buyer | Sale Price | Title Company |
|---|---|---|---|
| Welling James Joseph | $170,000 | Attorney | |
| Loughry Alean R | -- | -- | |
| Loughry Roy W | $169,900 | -- | |
| Rea Building Corp | $38,000 | -- | |
| -- | -- | -- | |
| -- | -- | -- |
Source: Public Records
Mortgage History
| Date | Status | Borrower | Loan Amount |
|---|---|---|---|
| Open | Welling James Joseph | $136,000 |
Source: Public Records
Tax History Compared to Growth
Tax History
| Year | Tax Paid | Tax Assessment Tax Assessment Total Assessment is a certain percentage of the fair market value that is determined by local assessors to be the total taxable value of land and additions on the property. | Land | Improvement |
|---|---|---|---|---|
| 2025 | -- | $89,080 | $21,280 | $67,800 |
| 2024 | -- | $89,080 | $21,280 | $67,800 |
| 2023 | $3,825 | $75,390 | $17,500 | $57,890 |
| 2022 | $3,797 | $75,390 | $17,500 | $57,890 |
| 2021 | $3,799 | $75,390 | $17,500 | $57,890 |
| 2020 | $3,499 | $63,670 | $15,090 | $48,580 |
| 2019 | $3,368 | $63,670 | $15,090 | $48,580 |
| 2018 | $3,385 | $63,670 | $15,090 | $48,580 |
| 2017 | $3,342 | $59,790 | $11,870 | $47,920 |
| 2016 | $3,352 | $59,790 | $11,870 | $47,920 |
| 2015 | $3,399 | $59,790 | $11,870 | $47,920 |
| 2014 | $1,043 | $50,690 | $10,050 | $40,640 |
| 2013 | $1,499 | $50,690 | $10,050 | $40,640 |
Source: Public Records
Map
Nearby Homes
- 6285 Cherry Blossom NW
- Saint Lawrence Estate Plan at Eastlake Meadows
- Versailles Estate Plan at Eastlake Meadows
- Savannah Estate Plan at Eastlake Meadows
- Cumberland Estate Plan at Eastlake Meadows
- Oak Park Estate Plan at Eastlake Meadows
- 5555 Stuber Dr NW
- 5814 Lake Cable Ave NW
- 5775 East Blvd NW
- 5309 S Island Dr NW
- 5390 Echodell Ave NW
- 5325 S Island Dr NW
- 5764 Oak Dr NW
- 5613 Stoney Ridge Rd NW
- 5437 Portage St NW
- 5858 Springlake Rd NW
- 6851 Lake Cable Ave NW
- 5550 West Blvd NW
- 4740 Echoglenn St NW
- 4987 Searls Dr NW
- 5140 Techwood St NW
- 6051 Kentview Ave NW
- 6035 Kentview Ave NW
- 6027 University Heights Cir NW
- 5154 Techwood St NW
- 6017 Kentview Ave NW
- 5119 Techwood St NW
- 5145 Techwood St NW
- 5101 Techwood St NW
- 6048 Kentview Ave NW
- 5168 Techwood St NW
- 6005 University Heights Cir NW
- 5083 Techwood St NW
- 6024 Kentview Ave NW
- 6040 University Heights Cir NW
- 5986 University Heights Cir NW
- 5179 Techwood St NW
- 6058 University Heights Cir NW
- 6006 Kentview Ave NW
- 5065 Techwood St NW