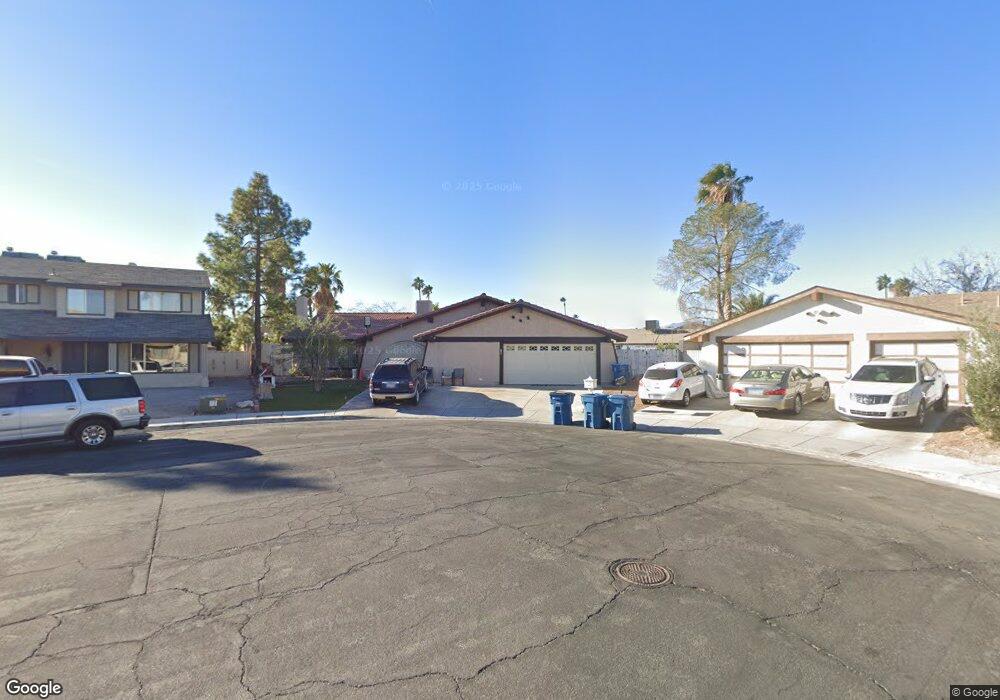
5127 Golden Rod Cir Unit 3 Las Vegas, NV 89146
Estimated Value: $454,000 - $514,000
4
Beds
2
Baths
1,788
Sq Ft
$266/Sq Ft
Est. Value
About This Home
This home is located at 5127 Golden Rod Cir Unit 3, Las Vegas, NV 89146 and is currently estimated at $475,858, approximately $266 per square foot. 5127 Golden Rod Cir Unit 3 is a home located in Clark County with nearby schools including Elaine Wynn Elementary School, Dr. C Owen Roundy Elementary School, and Kenny C Guinn Middle School.
Ownership History
Date
Name
Owned For
Owner Type
Purchase Details
Closed on
Jul 5, 2021
Sold by
Alvarez Elsa E
Bought by
La Loba Trust and Alvarez
Current Estimated Value
Purchase Details
Closed on
Mar 7, 2011
Sold by
Andrade Marina L
Bought by
Alvarez Elsa E
Purchase Details
Closed on
Feb 29, 2008
Sold by
Castillo Arias Juan and Castillo Maria D
Bought by
Andrade Marina L
Purchase Details
Closed on
Feb 20, 2006
Sold by
Castillo Arias Juan
Bought by
Castillo Arias Juan and Castillo Maria D
Purchase Details
Closed on
Sep 20, 2002
Sold by
Castillo Juan
Bought by
Castillo Arias Juan
Home Financials for this Owner
Home Financials are based on the most recent Mortgage that was taken out on this home.
Original Mortgage
$109,100
Interest Rate
6.16%
Create a Home Valuation Report for This Property
The Home Valuation Report is an in-depth analysis detailing your home's value as well as a comparison with similar homes in the area
Home Values in the Area
Average Home Value in this Area
Purchase History
| Date | Buyer | Sale Price | Title Company |
|---|---|---|---|
| La Loba Trust | -- | None Listed On Document | |
| Alvarez Elsa E | $113,237 | None Available | |
| Andrade Marina L | $227,000 | Commonwealth Title | |
| Castillo Arias Juan | -- | None Available | |
| Castillo Arias Juan | -- | First American Title Co |
Source: Public Records
Mortgage History
| Date | Status | Borrower | Loan Amount |
|---|---|---|---|
| Previous Owner | Castillo Arias Juan | $109,100 |
Source: Public Records
Tax History Compared to Growth
Tax History
| Year | Tax Paid | Tax Assessment Tax Assessment Total Assessment is a certain percentage of the fair market value that is determined by local assessors to be the total taxable value of land and additions on the property. | Land | Improvement |
|---|---|---|---|---|
| 2025 | $1,499 | $73,239 | $38,150 | $35,089 |
| 2024 | $1,456 | $73,239 | $38,150 | $35,089 |
| 2023 | $1,456 | $69,527 | $34,650 | $34,877 |
| 2022 | $1,414 | $60,309 | $27,650 | $32,659 |
| 2021 | $1,372 | $57,604 | $25,900 | $31,704 |
| 2020 | $1,329 | $57,322 | $25,200 | $32,122 |
| 2019 | $1,313 | $54,637 | $22,400 | $32,237 |
| 2018 | $1,253 | $52,496 | $21,000 | $31,496 |
| 2017 | $1,536 | $52,379 | $19,950 | $32,429 |
| 2016 | $1,174 | $46,811 | $13,300 | $33,511 |
| 2015 | $1,171 | $44,783 | $11,200 | $33,583 |
| 2014 | $1,137 | $39,746 | $5,950 | $33,796 |
Source: Public Records
Map
Nearby Homes
- 5132 Springland St
- 3214 Anacapa Way
- 4923 Strauss Dr
- 3212 Moonflower Dr
- 5006 Schumann Dr
- 5175 Palmyra Ave
- 5191 Pioneer Ave Unit 101
- 3346 Tiara Point Cir
- 5048 Via de Palma Dr
- 5045 Stampa Ave
- 5336 Regal Ave
- 3372 Westwind Rd
- 0 Spring Mountain Rd Unit 2562224
- 0 Spring Mountain Rd Unit 2562221
- 3090 Westwind Rd
- 5414 Stampa Ave
- 4533 W Desert Inn Rd
- 3262 Jericho St Unit B
- 4530 Sparky Dr Unit A
- 0 Palmyra Unit 2715168
- 5148 Springland St
- 5164 Springland St
- 3224 Anacapa Way
- 5138 Golden Rod Cir
- 5105 Golden Rod Cir
- 5128 Golden Rod Cir
- 5116 Springland St
- 5118 Golden Rod Cir
- 5118 Golden Rod Cir Unit n/a
- 5102 Golden Rod Cir
- 3239 Anacapa Way
- 5149 Springland St
- 3208 Anacapa Way
- 3249 Anacapa Way
- 3229 Anacapa Way
- 5133 Springland St
- 5161 Cereus Ct
- 5133 Cereus Ct