Estimated Value: $443,000 - $495,000
5
Beds
3
Baths
2,836
Sq Ft
$166/Sq Ft
Est. Value
About This Home
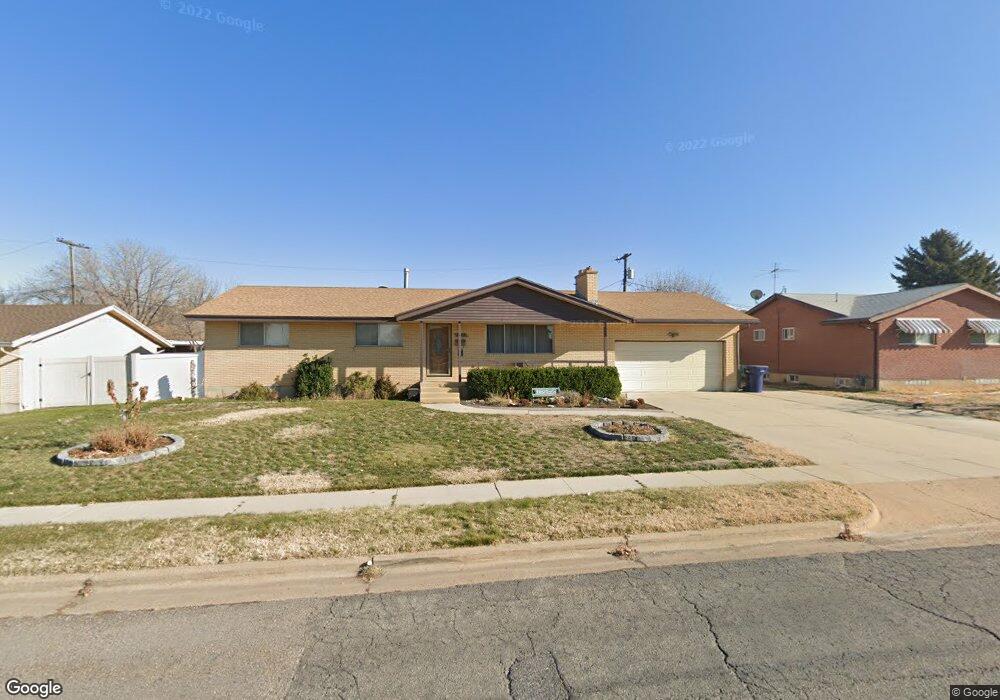
This home is located at 5128 S 2400 W, Roy, UT 84067 and is currently estimated at $470,345, approximately $165 per square foot. 5128 S 2400 W is a home located in Weber County with nearby schools including Lakeview Elementary School, Roy Junior High School, and Roy High School.
Ownership History
Date
Name
Owned For
Owner Type
Purchase Details
Closed on
Jun 18, 2020
Sold by
Nelson Reese J and Nelson Maria
Bought by
Johnson Matthew Scott
Current Estimated Value
Home Financials for this Owner
Home Financials are based on the most recent Mortgage that was taken out on this home.
Original Mortgage
$299,250
Outstanding Balance
$265,262
Interest Rate
3.2%
Mortgage Type
New Conventional
Estimated Equity
$205,083
Purchase Details
Closed on
Feb 27, 1998
Sold by
Nelson Reese J
Bought by
Nelson Reese J and Nelson Maria
Home Financials for this Owner
Home Financials are based on the most recent Mortgage that was taken out on this home.
Original Mortgage
$93,420
Interest Rate
6.99%
Mortgage Type
VA
Purchase Details
Closed on
Sep 18, 1996
Sold by
Nelson Maria L
Bought by
Nelson Reese J
Home Financials for this Owner
Home Financials are based on the most recent Mortgage that was taken out on this home.
Original Mortgage
$91,978
Interest Rate
7.87%
Mortgage Type
VA
Create a Home Valuation Report for This Property
The Home Valuation Report is an in-depth analysis detailing your home's value as well as a comparison with similar homes in the area
Home Values in the Area
Average Home Value in this Area
Purchase History
| Date | Buyer | Sale Price | Title Company |
|---|---|---|---|
| Johnson Matthew Scott | -- | Metro National Title Assc | |
| Nelson Reese J | -- | Associated Title | |
| Nelson Reese J | -- | Reliable Title |
Source: Public Records
Mortgage History
| Date | Status | Borrower | Loan Amount |
|---|---|---|---|
| Open | Johnson Matthew Scott | $299,250 | |
| Previous Owner | Nelson Reese J | $93,420 | |
| Previous Owner | Nelson Reese J | $91,978 |
Source: Public Records
Tax History Compared to Growth
Tax History
| Year | Tax Paid | Tax Assessment Tax Assessment Total Assessment is a certain percentage of the fair market value that is determined by local assessors to be the total taxable value of land and additions on the property. | Land | Improvement |
|---|---|---|---|---|
| 2025 | $2,980 | $478,826 | $120,000 | $358,826 |
| 2024 | $2,820 | $250,249 | $66,000 | $184,249 |
| 2023 | $2,543 | $224,400 | $63,153 | $161,247 |
| 2022 | $2,776 | $254,100 | $57,754 | $196,346 |
| 2021 | $2,161 | $323,000 | $69,994 | $253,006 |
| 2020 | $2,040 | $280,000 | $69,994 | $210,006 |
| 2019 | $2,030 | $263,000 | $40,019 | $222,981 |
| 2018 | $1,884 | $229,000 | $37,012 | $191,988 |
| 2017 | $190 | $200,000 | $37,012 | $162,988 |
| 2016 | $1,690 | $103,158 | $19,021 | $84,137 |
| 2015 | $1,527 | $94,956 | $19,021 | $75,935 |
| 2014 | $1,539 | $94,820 | $16,160 | $78,660 |
Source: Public Records
Map
Nearby Homes