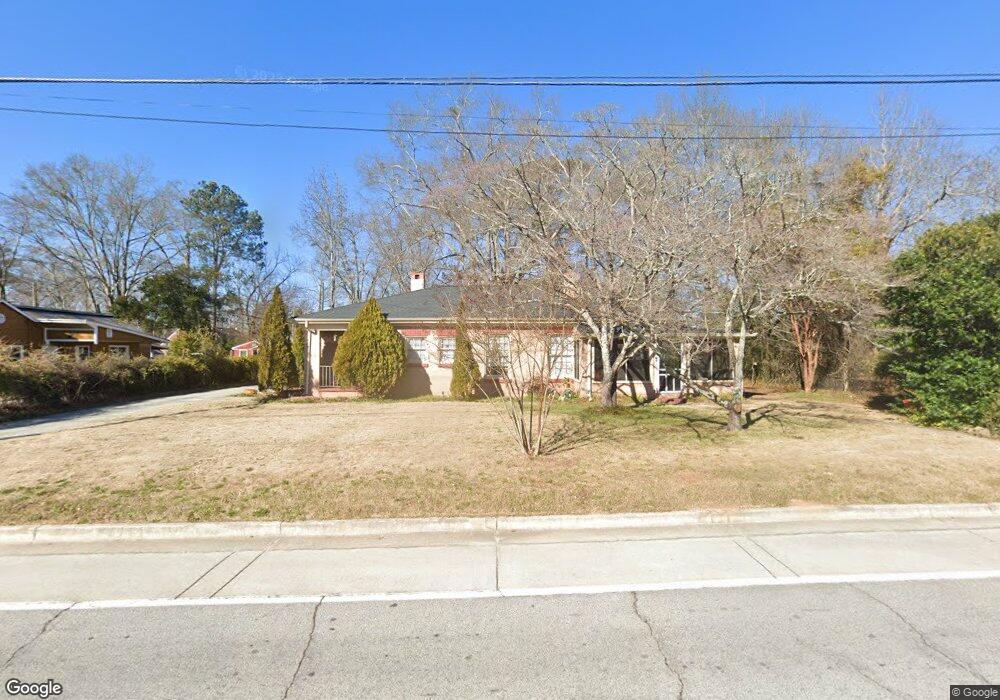
5129 Newton Dr NE Covington, GA 30014
Estimated Value: $224,000 - $271,000
--
Bed
1
Bath
1,444
Sq Ft
$171/Sq Ft
Est. Value
About This Home
This home is located at 5129 Newton Dr NE, Covington, GA 30014 and is currently estimated at $247,482, approximately $171 per square foot. 5129 Newton Dr NE is a home located in Newton County with nearby schools including East Newton Elementary School, Cousins Middle School, and Eastside High School.
Ownership History
Date
Name
Owned For
Owner Type
Purchase Details
Closed on
Jul 19, 2016
Sold by
Johnson Ann
Bought by
Pace Pamela J
Current Estimated Value
Purchase Details
Closed on
Apr 25, 2016
Sold by
Hart Rebecca H
Bought by
Pace Pamela J and Hodges Ann Johnson
Purchase Details
Closed on
Jan 10, 2014
Sold by
Pace Pamela J
Bought by
Hart Rebecca H
Home Financials for this Owner
Home Financials are based on the most recent Mortgage that was taken out on this home.
Original Mortgage
$80,000
Interest Rate
4.44%
Mortgage Type
New Conventional
Purchase Details
Closed on
Nov 27, 2006
Sold by
Pace Richard H
Bought by
Harris Joseph L
Home Financials for this Owner
Home Financials are based on the most recent Mortgage that was taken out on this home.
Original Mortgage
$98,000
Interest Rate
6.31%
Mortgage Type
Trade
Purchase Details
Closed on
Sep 18, 1995
Sold by
Draughon Jane
Bought by
Pace Richard and Hodaes Robert
Create a Home Valuation Report for This Property
The Home Valuation Report is an in-depth analysis detailing your home's value as well as a comparison with similar homes in the area
Home Values in the Area
Average Home Value in this Area
Purchase History
| Date | Buyer | Sale Price | Title Company |
|---|---|---|---|
| Pace Pamela J | -- | -- | |
| Pace Pamela J | -- | -- | |
| Hart Rebecca H | $80,000 | -- | |
| Pace Pamela J | -- | -- | |
| Pace Richard H | -- | -- | |
| Harris Joseph L | $101,000 | -- | |
| Pace Richard | $45,000 | -- |
Source: Public Records
Mortgage History
| Date | Status | Borrower | Loan Amount |
|---|---|---|---|
| Previous Owner | Pace Richard H | $80,000 | |
| Previous Owner | Harris Joseph L | $98,000 |
Source: Public Records
Tax History Compared to Growth
Tax History
| Year | Tax Paid | Tax Assessment Tax Assessment Total Assessment is a certain percentage of the fair market value that is determined by local assessors to be the total taxable value of land and additions on the property. | Land | Improvement |
|---|---|---|---|---|
| 2024 | $2,410 | $79,800 | $17,200 | $62,600 |
| 2023 | $1,709 | $52,600 | $8,800 | $43,800 |
| 2022 | $1,590 | $48,920 | $8,800 | $40,120 |
| 2021 | $1,541 | $42,440 | $8,800 | $33,640 |
| 2020 | $1,626 | $40,760 | $8,800 | $31,960 |
| 2019 | $1,680 | $41,360 | $8,800 | $32,560 |
| 2018 | $839 | $40,840 | $6,000 | $34,840 |
| 2017 | $1,154 | $28,080 | $2,000 | $26,080 |
| 2016 | $1,187 | $28,880 | $2,800 | $26,080 |
| 2015 | $1,241 | $30,160 | $2,000 | $28,160 |
| 2014 | $1,241 | $30,160 | $0 | $0 |
Source: Public Records
Map
Nearby Homes
- 5130 N Dearing St NE
- 4105 Rose Ln NE
- 4217 Elizabeth St NE
- 5139 West Dr NE
- 0 Highway 278 NE Unit 10595588
- 4128 Elizabeth St NE
- 6127 Floyd St NE
- 5150 Wheat St NE
- 4181 A&B Floyd St NE
- 6104 Floyd St NE
- 5118 Floyd St NE
- 3127 Mill St SE
- 6192 Collins St NE
- 6193 Collins St NE
- 3149 Thompson Ave SE
- 3112 Floyd St NE
- 3183 Conyers St SE
- 2173 Anderson Ave SE
- 2133 Thompson Ave SE
- 4187 Cherry Laurel Dr SE
- 5137 Newton Dr NE
- 5143 Newton Dr NE
- 5117 Newton Dr NE
- 5118 Newton Dr NE
- 5109 Newton Dr NE
- 5178 Hartsook Dr NE
- 5123 Cook St NE
- 5122 Bede Dr NE Unit A
- 5122 Bede Dr NE
- 5177 Hartsook Dr NE
- 5184 N Dearing St NE
- 5108 Newton Dr NE
- 5118 Bede Dr NE
- 5118 Bede Dr NE Unit B
- 5118 Bede Dr NE Unit A
- 5155 Newton Dr NE
- 5148 Newton Dr NE
- 5110 Bede Dr NE
- 5171 Hartsook Dr NE
- 5130 Bede Dr NE