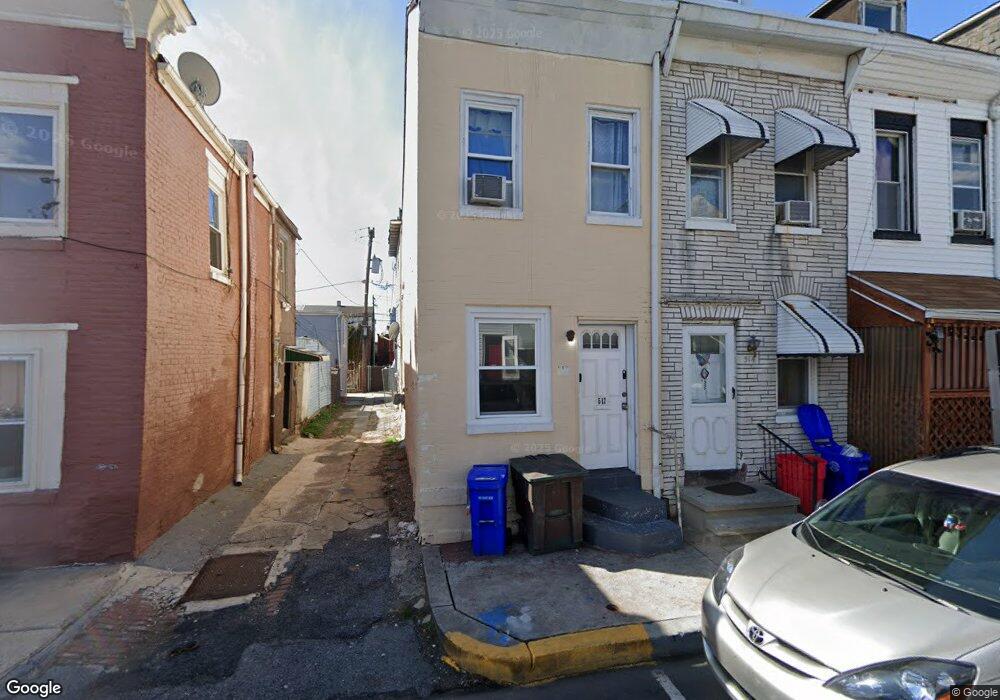
512R Cedar St Reading, PA 19601
Southeast Reading NeighborhoodEstimated Value: $71,756 - $141,000
2
Beds
1
Bath
784
Sq Ft
$135/Sq Ft
Est. Value
About This Home
This home is located at 512R Cedar St, Reading, PA 19601 and is currently estimated at $105,939, approximately $135 per square foot. 512R Cedar St is a home located in Berks County with nearby schools including Tenth & Green El School, Central Middle School, and Reading Senior High School.
Ownership History
Date
Name
Owned For
Owner Type
Purchase Details
Closed on
Aug 16, 2022
Sold by
Mauro Fiorentino Jonathan
Bought by
Mjk North Reading Rentals Llc
Current Estimated Value
Purchase Details
Closed on
Mar 24, 2017
Sold by
Fiorentino Mauro J
Bought by
Fiorention Jonathan Mauro
Purchase Details
Closed on
Mar 28, 2007
Sold by
Torres Rafael and Pagan Nelson D
Bought by
Florentino Mauro J
Purchase Details
Closed on
Jan 28, 2005
Sold by
Bailey Christine A
Bought by
Torres Rafael and Pagan Nelson D
Create a Home Valuation Report for This Property
The Home Valuation Report is an in-depth analysis detailing your home's value as well as a comparison with similar homes in the area
Home Values in the Area
Average Home Value in this Area
Purchase History
| Date | Buyer | Sale Price | Title Company |
|---|---|---|---|
| Mjk North Reading Rentals Llc | $3,200 | -- | |
| Fiorention Jonathan Mauro | -- | None Available | |
| Florentino Mauro J | $12,000 | None Available | |
| Torres Rafael | $6,000 | -- |
Source: Public Records
Tax History Compared to Growth
Tax History
| Year | Tax Paid | Tax Assessment Tax Assessment Total Assessment is a certain percentage of the fair market value that is determined by local assessors to be the total taxable value of land and additions on the property. | Land | Improvement |
|---|---|---|---|---|
| 2025 | $293 | $10,800 | $3,300 | $7,500 |
| 2024 | $480 | $10,800 | $3,300 | $7,500 |
| 2023 | $472 | $10,800 | $3,300 | $7,500 |
| 2022 | $472 | $10,800 | $3,300 | $7,500 |
| 2021 | $472 | $10,800 | $3,300 | $7,500 |
| 2020 | $467 | $10,800 | $3,300 | $7,500 |
| 2019 | $467 | $10,800 | $3,300 | $7,500 |
| 2018 | $467 | $10,800 | $3,300 | $7,500 |
| 2017 | $464 | $10,800 | $3,300 | $7,500 |
| 2016 | $265 | $10,800 | $3,300 | $7,500 |
| 2015 | $265 | $10,800 | $3,300 | $7,500 |
| 2014 | $244 | $10,800 | $3,300 | $7,500 |
Source: Public Records
Map
Nearby Homes