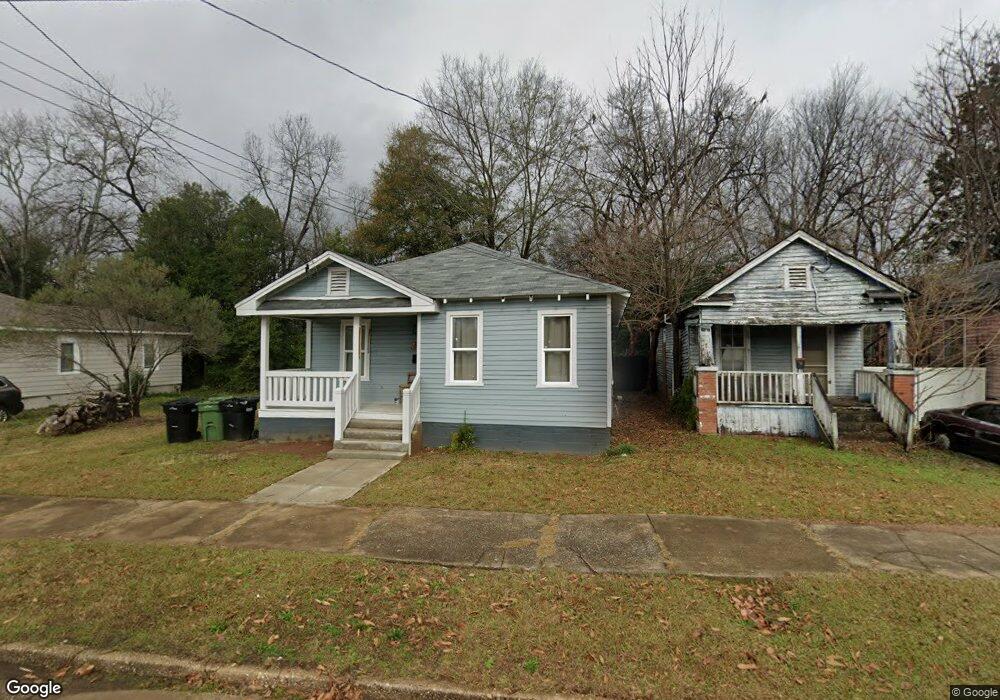
513 35th St Columbus, GA 31904
North Highlands NeighborhoodEstimated Value: $71,000 - $103,000
3
Beds
2
Baths
1,064
Sq Ft
$80/Sq Ft
Est. Value
About This Home
This home is located at 513 35th St, Columbus, GA 31904 and is currently estimated at $84,972, approximately $79 per square foot. 513 35th St is a home located in Muscogee County with nearby schools including Fox Elementary School, Double Churches Middle School, and Jordan Vocational High School.
Ownership History
Date
Name
Owned For
Owner Type
Purchase Details
Closed on
Dec 17, 2021
Sold by
Truth Spring Inc
Bought by
Thuth Spring Real Estate Llc
Current Estimated Value
Purchase Details
Closed on
Jul 13, 2017
Bought by
Truth Spring Inc
Purchase Details
Closed on
Oct 11, 2016
Bought by
Highland Community Church Inc
Purchase Details
Closed on
Jul 9, 2015
Sold by
Cf Properties Llc
Bought by
Home Invesments Inc
Home Financials for this Owner
Home Financials are based on the most recent Mortgage that was taken out on this home.
Original Mortgage
$15,000
Interest Rate
4.08%
Mortgage Type
New Conventional
Purchase Details
Closed on
Oct 31, 2014
Sold by
Fielder William A
Bought by
Cf Properties Llc
Create a Home Valuation Report for This Property
The Home Valuation Report is an in-depth analysis detailing your home's value as well as a comparison with similar homes in the area
Home Values in the Area
Average Home Value in this Area
Purchase History
| Date | Buyer | Sale Price | Title Company |
|---|---|---|---|
| Thuth Spring Real Estate Llc | -- | Page Scrantom Sprouse Tucker & | |
| Truth Spring Real Estate Llc | -- | -- | |
| Truth Spring Inc | $35,000 | -- | |
| Highland Community Church Inc | $65,000 | -- | |
| Home Invesments Inc | $18,000 | -- | |
| Cf Properties Llc | $593,000 | -- |
Source: Public Records
Mortgage History
| Date | Status | Borrower | Loan Amount |
|---|---|---|---|
| Previous Owner | Home Invesments Inc | $15,000 |
Source: Public Records
Tax History Compared to Growth
Tax History
| Year | Tax Paid | Tax Assessment Tax Assessment Total Assessment is a certain percentage of the fair market value that is determined by local assessors to be the total taxable value of land and additions on the property. | Land | Improvement |
|---|---|---|---|---|
| 2025 | $807 | $20,612 | $4,564 | $16,048 |
| 2024 | $807 | $20,612 | $4,564 | $16,048 |
| 2023 | $721 | $18,300 | $4,564 | $13,736 |
| 2022 | $527 | $12,904 | $3,196 | $9,708 |
| 2021 | $442 | $10,800 | $3,196 | $7,604 |
| 2020 | $441 | $10,800 | $3,196 | $7,604 |
| 2019 | $353 | $8,616 | $3,196 | $5,420 |
| 2018 | $353 | $8,616 | $3,196 | $5,420 |
| 2017 | $626 | $13,553 | $2,947 | $10,606 |
| 2016 | $297 | $7,200 | $753 | $6,447 |
| 2015 | $55 | $3,321 | $753 | $2,568 |
| 2014 | $112 | $6,797 | $753 | $6,044 |
| 2013 | -- | $6,797 | $753 | $6,044 |
Source: Public Records
Map
Nearby Homes