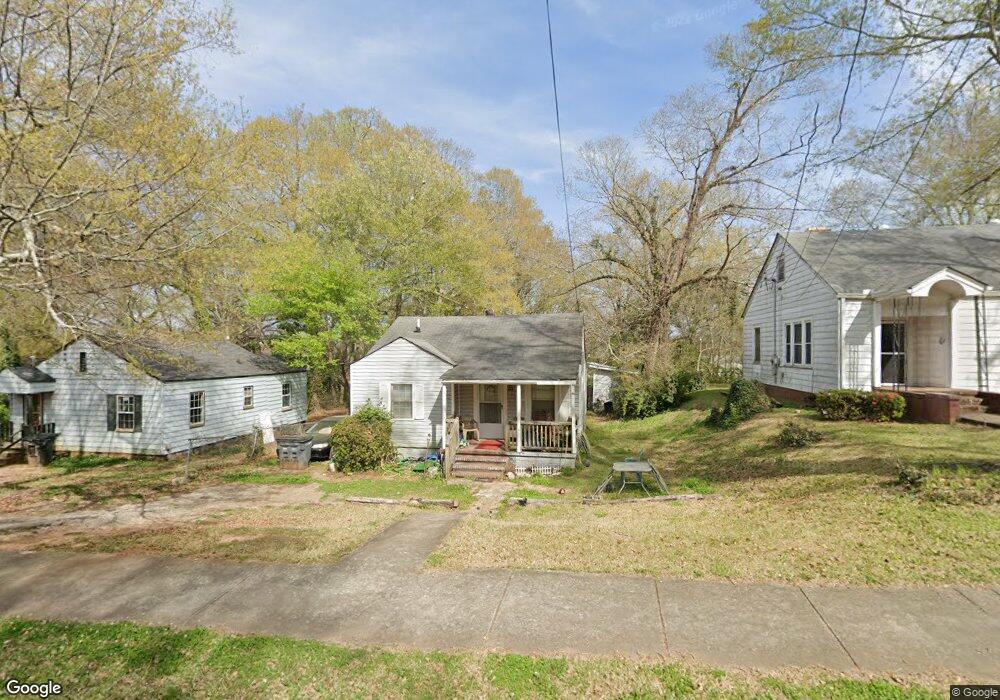
513 Alford St Lagrange, GA 30240
Estimated Value: $99,000 - $352,000
2
Beds
1
Bath
960
Sq Ft
$192/Sq Ft
Est. Value
About This Home
This home is located at 513 Alford St, Lagrange, GA 30240 and is currently estimated at $184,000, approximately $191 per square foot. 513 Alford St is a home located in Troup County with nearby schools including Ethel W. Kight Elementary School, Hollis Hand Elementary School, and Franklin Forest Elementary School.
Ownership History
Date
Name
Owned For
Owner Type
Purchase Details
Closed on
Feb 4, 2022
Sold by
S & S Lagrange Llc
Bought by
Sfr3 040 Llc
Current Estimated Value
Purchase Details
Closed on
Jan 16, 2007
Sold by
Whitley Susan Dawn
Bought by
S S Lagrange Llc
Purchase Details
Closed on
Dec 12, 2003
Sold by
Michael H Thrower
Bought by
Whitley Susan
Purchase Details
Closed on
May 10, 1977
Sold by
Administrator Of Veterans Aff
Bought by
Michael H Thrower
Purchase Details
Closed on
Dec 9, 1976
Sold by
Engel Mortgage Co Inc
Bought by
Administrator Of Veterans Aff
Purchase Details
Closed on
Dec 8, 1976
Sold by
Burnham William C
Bought by
Engel Mortgage Co Inc
Purchase Details
Closed on
Nov 1, 1974
Sold by
Moore Perry G
Bought by
Burnham William C
Purchase Details
Closed on
Jan 1, 1972
Sold by
Smith Randall H
Bought by
Moore Perry G
Purchase Details
Closed on
Aug 1, 1968
Sold by
Burson Kenneth E
Bought by
Smith Randall H
Create a Home Valuation Report for This Property
The Home Valuation Report is an in-depth analysis detailing your home's value as well as a comparison with similar homes in the area
Home Values in the Area
Average Home Value in this Area
Purchase History
| Date | Buyer | Sale Price | Title Company |
|---|---|---|---|
| Sfr3 040 Llc | $456,800 | -- | |
| S S Lagrange Llc | $15,000 | -- | |
| Whitley Susan | -- | -- | |
| Michael H Thrower | $15,900 | -- | |
| Administrator Of Veterans Aff | -- | -- | |
| Engel Mortgage Co Inc | -- | -- | |
| Burnham William C | $15,200 | -- | |
| Moore Perry G | $8,700 | -- | |
| Smith Randall H | $6,000 | -- |
Source: Public Records
Tax History Compared to Growth
Tax History
| Year | Tax Paid | Tax Assessment Tax Assessment Total Assessment is a certain percentage of the fair market value that is determined by local assessors to be the total taxable value of land and additions on the property. | Land | Improvement |
|---|---|---|---|---|
| 2024 | $529 | $19,396 | $3,240 | $16,156 |
| 2023 | $399 | $17,204 | $3,240 | $13,964 |
| 2022 | $460 | $16,484 | $3,240 | $13,244 |
| 2021 | $271 | $8,976 | $3,240 | $5,736 |
| 2020 | $271 | $8,976 | $3,240 | $5,736 |
| 2019 | $224 | $7,430 | $2,250 | $5,180 |
| 2018 | $224 | $7,430 | $2,250 | $5,180 |
| 2017 | $224 | $7,430 | $2,250 | $5,180 |
| 2016 | $222 | $7,366 | $2,250 | $5,116 |
| 2015 | $228 | $7,561 | $2,444 | $5,116 |
| 2014 | $229 | $7,561 | $2,444 | $5,116 |
| 2013 | -- | $9,920 | $3,259 | $6,661 |
Source: Public Records
Map
Nearby Homes
- 511 Alford St
- 515 Alford St
- 509 Alford St
- 204 Wilkes St
- 507 Alford St
- 202 Wilkes St
- 512 Harwell Ave
- 505 Alford St
- 510 Harwell Ave
- 300 Wilkes St
- 508 Harwell Ave
- 514 Harwell Ave
- 516 Harwell Ave
- 506 Harwell Ave
- 503 Alford St
- 510 Alford St Unit 510B
- 510 Alford St Unit 510A
- 510 Alford St
- 518 Harwell Ave
- 504 Alford St